Contact us
+316 51978796
sales@phenovation.nl

CF2GO Photosynthesis Sensor
Discover the CF2GO, a state-of-the-art photosynthesis efficiency sensor developed for climate and environmental research and optimalisation. Primarily used in greenhouses to optimize production, CF2GO provides precise, real-time insights into plant health by measuring photosynthetic efficiency. With its early warning system for detecting plant stress, CF2GO empowers you to effectively manage and fine-tune growing conditions for better yields.
CF2GO
Measuring photosynthesis efficiency in a production environment
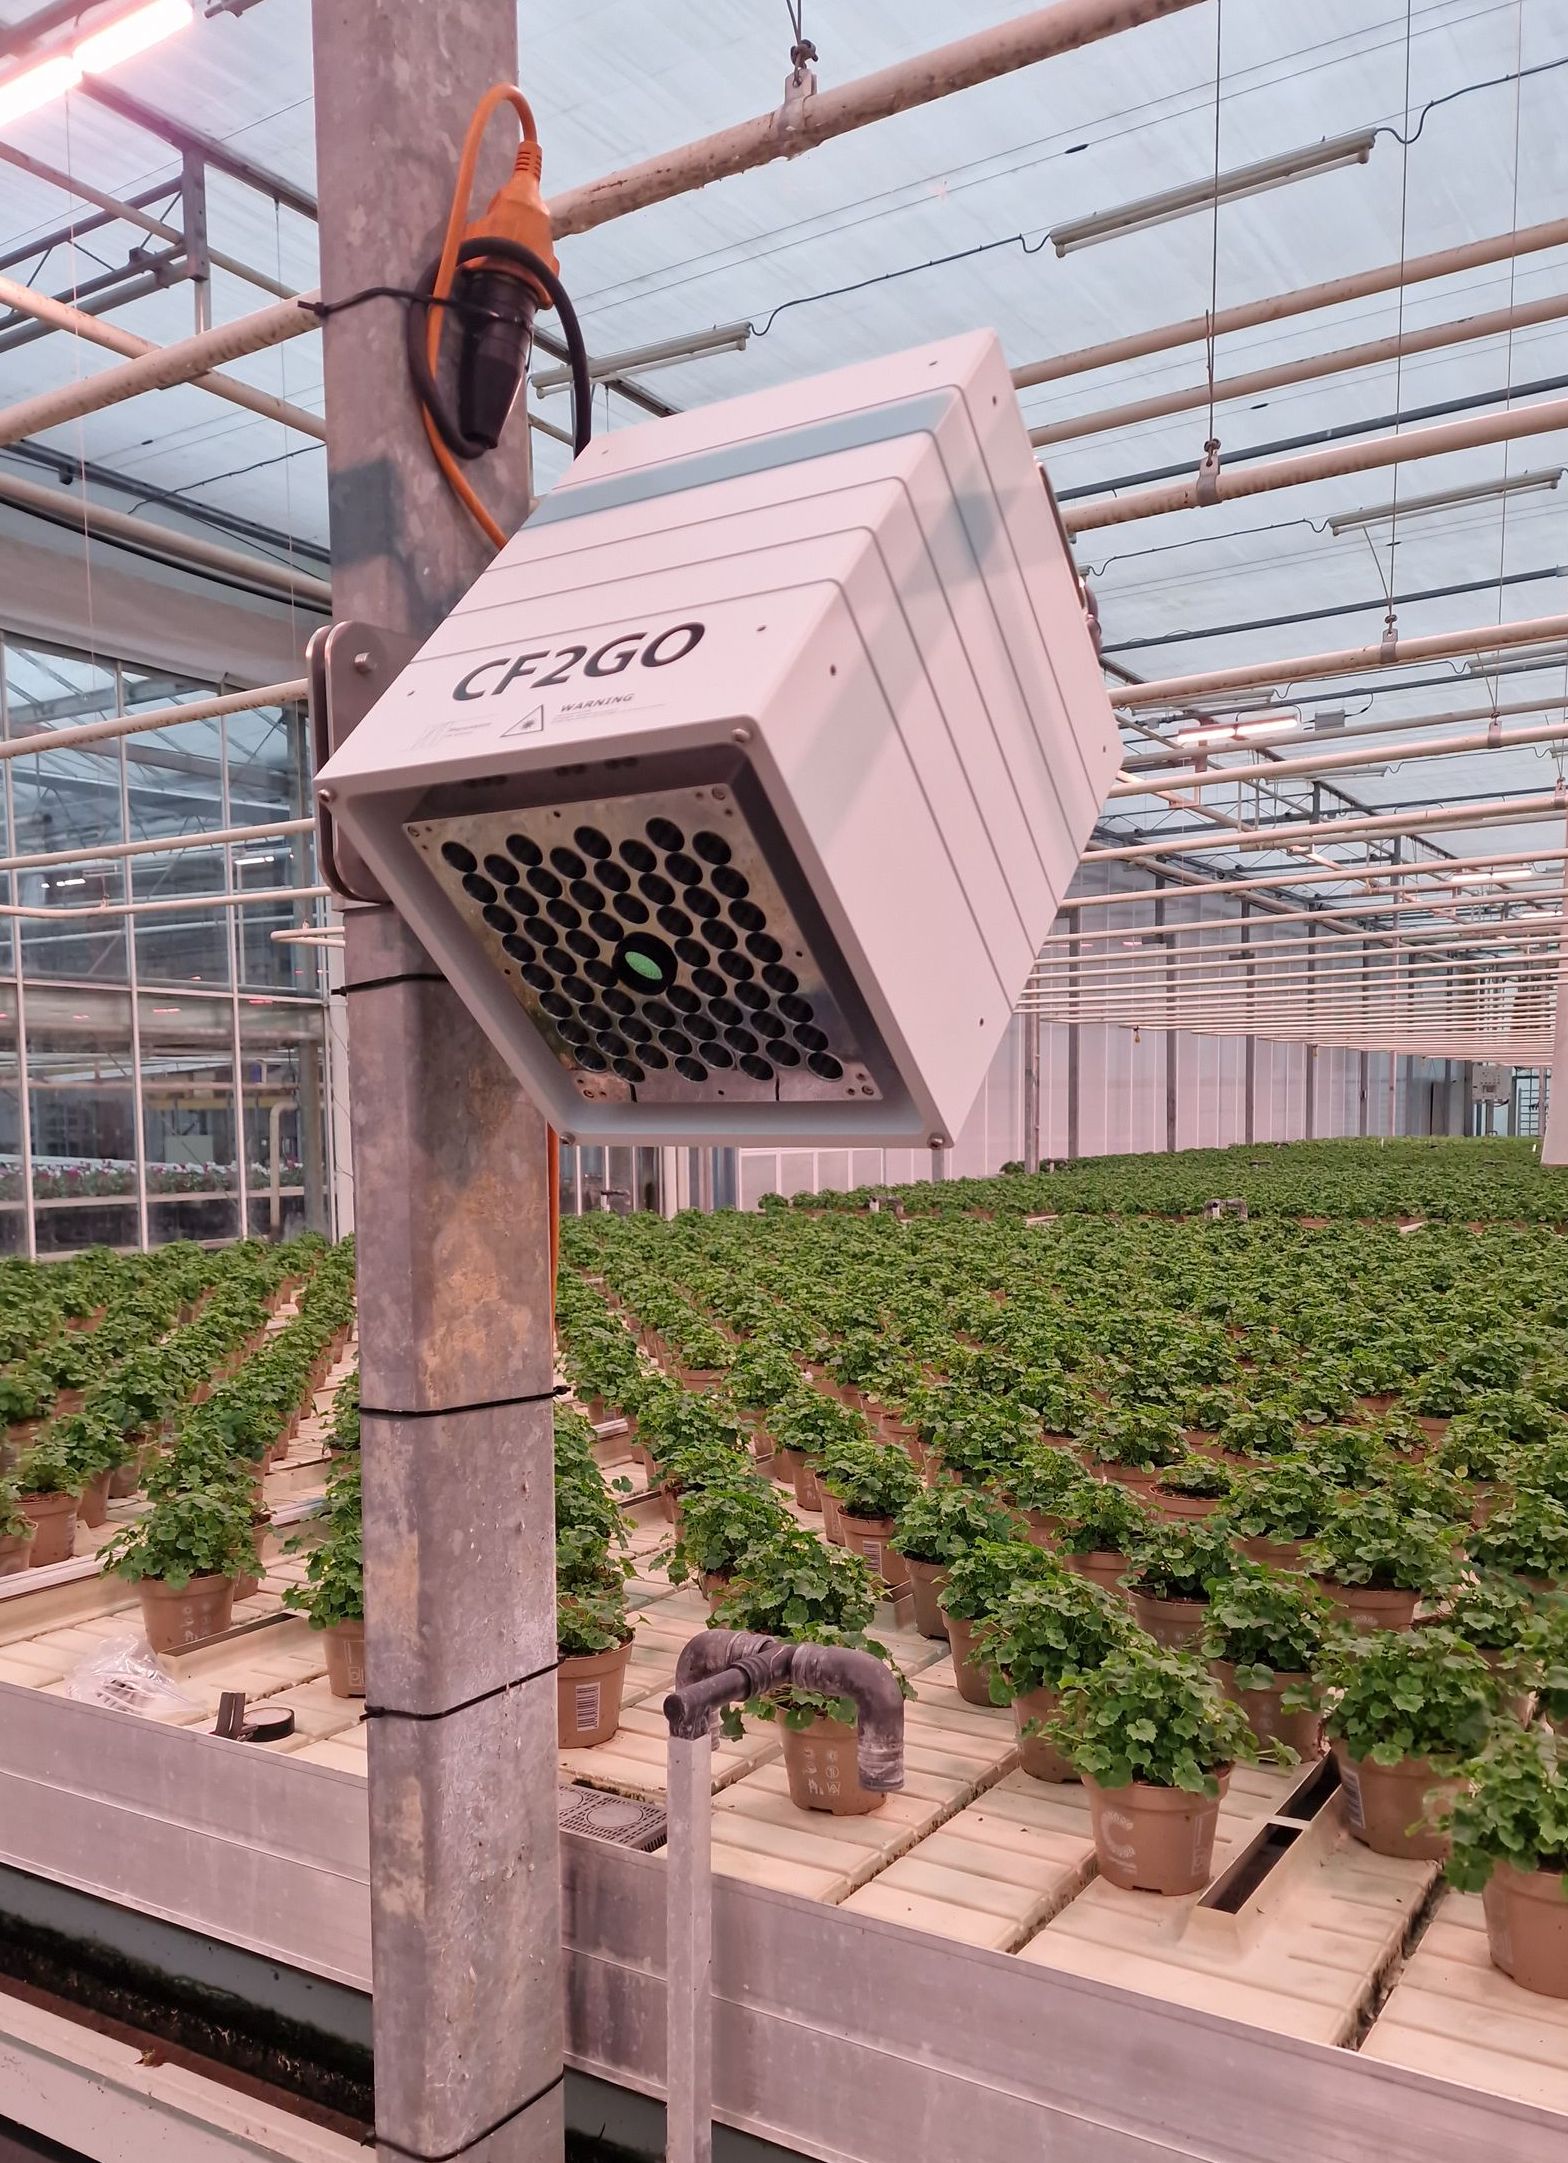
CF2GO (Chlorophyll Fluorescence 2 Go) lives up to its name by offering convenient, on-the-go measurement of photosynthetic efficiency. It can be mounted on a linear axis, like a spray boom, or installed in a fixed position in the greenhouse for real-time monitoring. By measuring from up to 100 centimeters away, CF2GO eliminates the need to attach sensors directly to leaves. Even if plants move beneath the device, the system automatically detects whether plant material is present, ensuring accurate and continuous data collection.
Specifications
| Dimensions | 260mm x 260mm x 340mm |
|---|---|
| Weight | 20Kg |
| Material | Aluminium powder coated |
| Voltage | 100 - 264 (1P+N+PE) |
| Watt | 1000 |
| Measurement size | 100mm x 100mm |
| Measurement disctace | 300mm -1000mm |
| Needed connections | Internet & Power |
Unveiling Photosynthetic Efficiency
The CF2GO is designed to scientifically measure photosynthesis efficiency in greenhouses without any physical contact with the plants. Positioned up to 1000mm away, it delivers real-time, accurate, and non-invasive monitoring. This enables real-time plant health data, allowing greenhouse climate control based on plant health indices rather than fixed parameters like DLI and VPD ranges.
Key Measurements
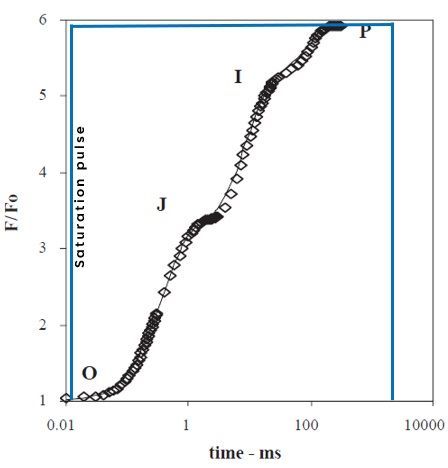
The CF2GO is able to measure the entire OJIP curve at a sampling rate of up to 1000 samples per second. Because of this unique feature multiple indices of the photosynthesis system can be measured. These are the following measured / calculated parameters.
F0 - Fj - Fi - Fm - F0/Fj - F0/Fi - Fv/Fm - Fi/Fm - Fj/Fm - TFm - Vj - M0 - Area Fv - Nto - Bav - Pridx
The measurments are based on literature and are derived from this paper:
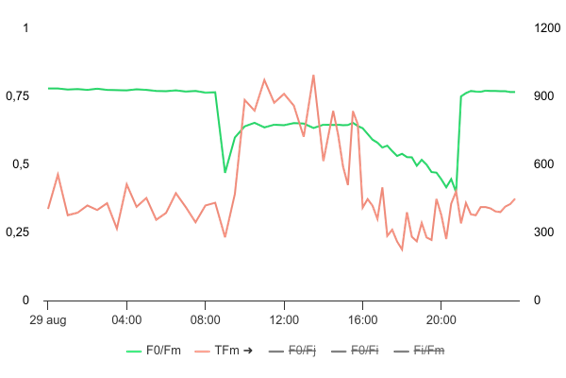
This graph displays the Fv/Fm and TFm measurements in a climate cabinet under continuous light. As clearly shown, both Fv/Fm and TFm respond in the afternoon when the orchid has depleted its CO₂ supply.
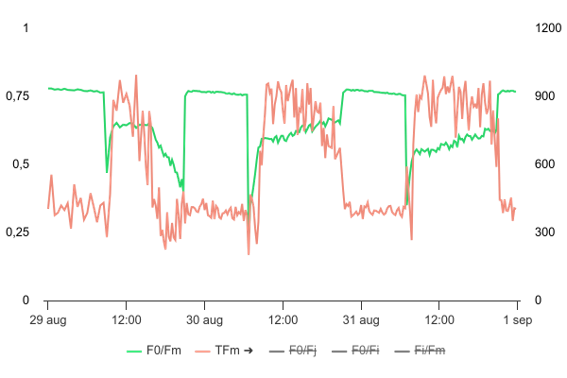
This graph presents the Fv/Fm and TFm measurements in a climate cabinet under continuous light. It clearly shows that both Fv/Fm and TFm recover over time. While Fv/Fm begins to recover after just one day, TFm indicates that full recovery takes an additional day.
For more information click here
Integration into MyLedgnd
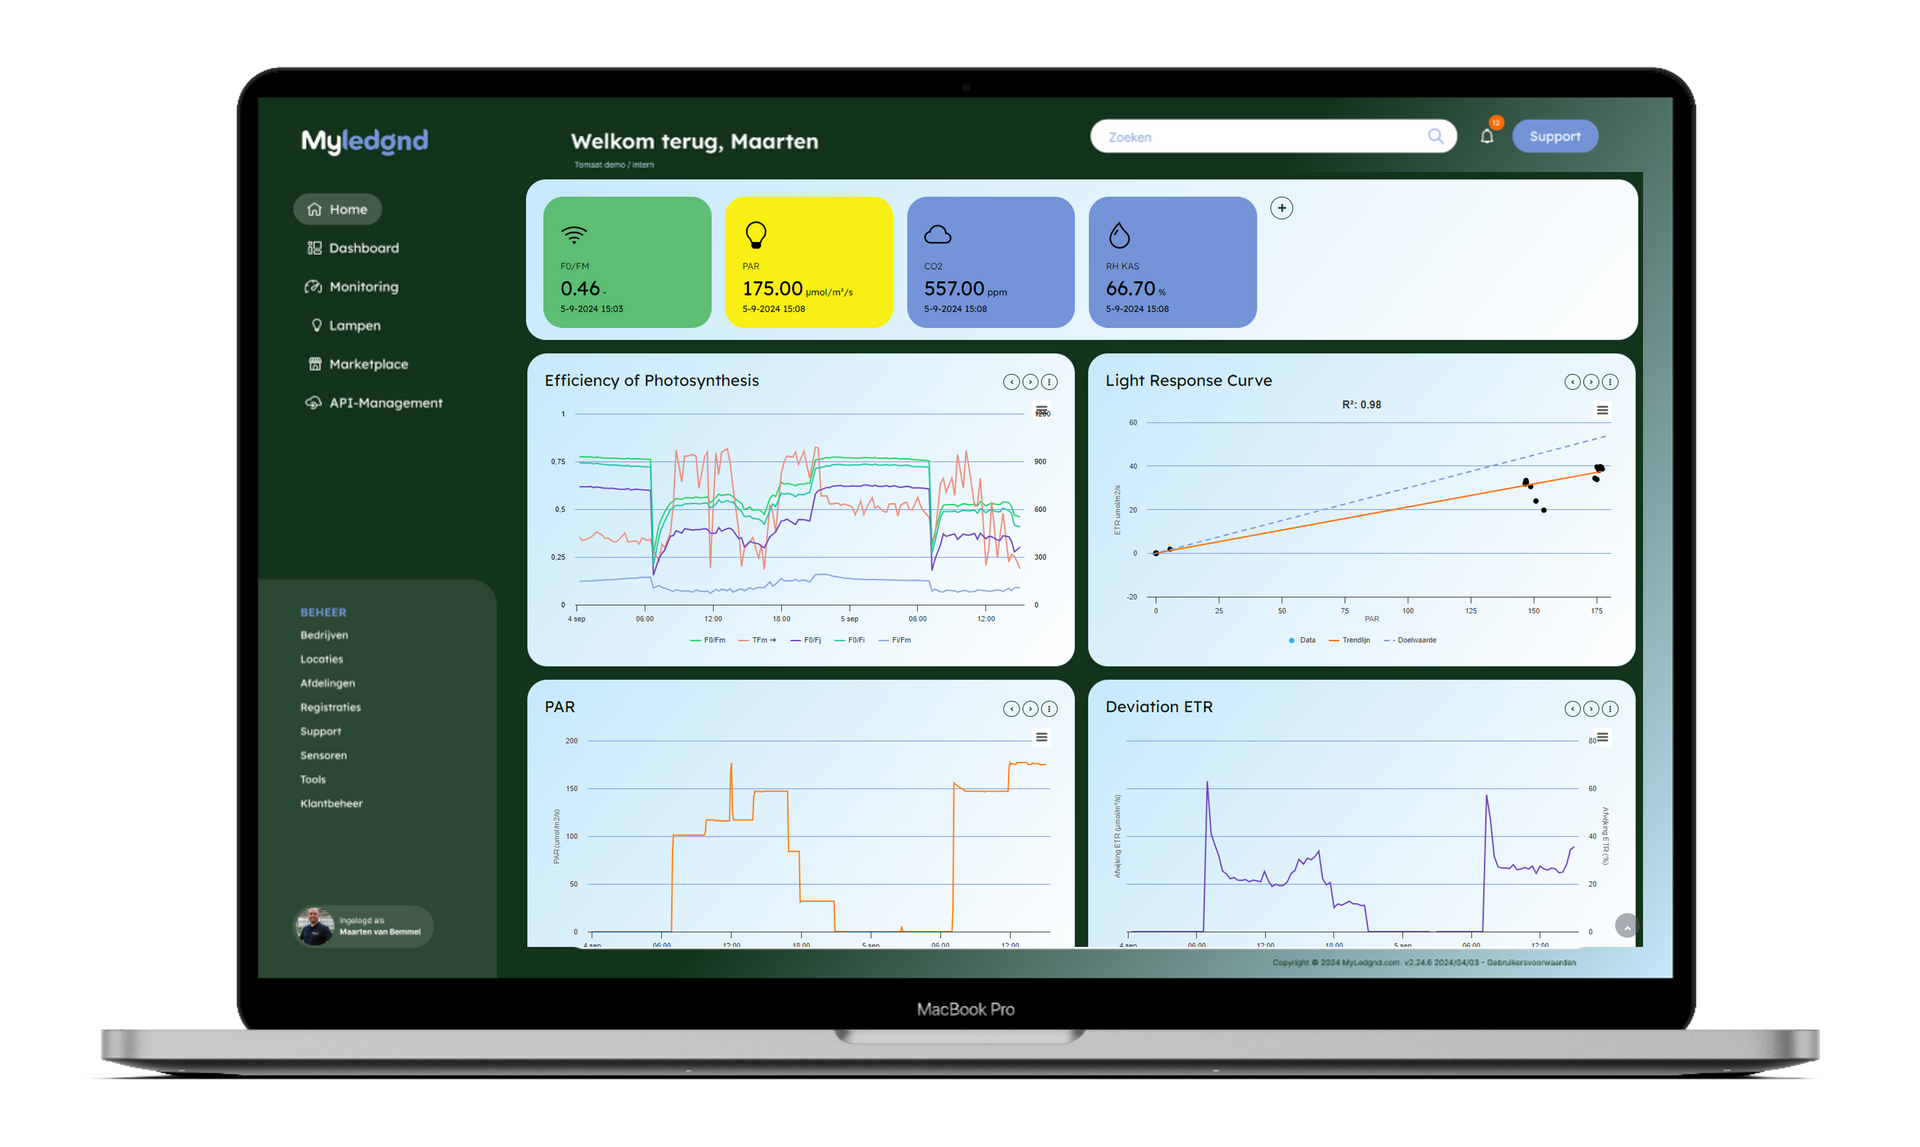
The CF2GO sensor seamlessly integrates with the MyLedgnd online data platform, where all collected data is processed and displayed in a structured and intuitive interface. This allows growers to gain deeper insights into their cultivation processes and make data-driven adjustments, such as optimizing shading, lighting, and other critical greenhouse parameters.
Unlike traditional environmental sensors, the CF2GO provides direct insights into how crops respond to their surroundings. By integrating CF2GO data into MyLedgnd, growers can monitor photosynthesis efficiency, track plant responses to changing conditions, and analyze the effects of light and temperature in real time.
With a complete overview of plant health and performance, MyLedgnd enables precise climate control based on actual plant responses rather than fixed parameters. This data-driven approach supports more efficient greenhouse management, ensuring optimal growth conditions while maximizing yield and quality.
The science behind our Sensor
OJIP 1000 Samples per second
The OJIP curve is an advanced method for analyzing photosynthetic efficiency, providing deeper insights than traditional PAM fluorometry. By measuring additional parameters, the OJIP curve offers a more detailed view of how light energy is used in photosynthesis.
This technique involves capturing the fluorescence emission of chlorophyll in response to a saturating light pulse, creating a curve with four distinct phases: O, J, I, and P. Each phase represents different states of the photosynthetic apparatus, from the initial energy capture to the complete reduction of the electron transport chain.
Do you have a question?
We are here to answer all your questions. Don't hesitate to contact our experts to find out everything about photosynthesis, color imaging and everything in between.
What do our clients say?
Our references.
Magdalena Julkowska (Boyce Thompson Institute)
Sina Roth (Bayer)

Prof. Kris Audenaert (Ghent University)
Dr. Katie Murphy (Donald Danforth Plant Science Center)
Michael Meijler WPS

Dr. Noémie De Zutter (Ghent University)
Phenovation B.V.
Phone: +316 51978796
Mail: info@phenovation.nl
Agro business park 65a
6708 PV Wageningen
The Netherlands
KvK: 94329826
VAT: NL866736748B01
HS: 9031499090
Navigation
Alle rechten voorbehouden | Phenovation
Design by maxom.nl
Plant Phenotyping
