PlantExplorer MAX+
The PlantExplorer MAX+ is an advanced plant phenotyping and photosynthesis measurement system designed to deliver real-time, high-precision insights into plant health and performance. Combining chlorophyll fluorescence, GFP and RFP imaging,, multispectral, and color imaging, it enables accurate detection of plant stress, photosynthetic efficiency, and key physiological traits. Ideal for researchers and breeding programs, the PlantExplorer MAX+ provides comprehensive, quantitative data to understand plant behavior under varying environmental conditions — helping accelerate discoveries in plant science, crop optimization, and stress physiology.
Specifications
| Dimensions | 1200mm x 850mm x 2000mm |
|---|---|
| Weight | 225Kg |
| Material | Aluminium |
| Voltage | 196-305 (3P+N+PE) |
| Watt | 10.000 |
| Imaging size | 740mm x 740mm |
| Maximum plant height | 1200mm |
Multidimensional
The PlantExplorer MAX+ is designed as an high end imaging system to measure Pulse Amplitude Modulated (PAM) and Inductions curve (OJIP) chlorophyll fluorescence in combination with absorption of chlorophyll, multispectral, color and morphological parameters. The PlantExplorer MAX+ has a build in industrial grade computer with 16gb of RAM and 1 Tb of storage.
Key Features
- Standard High resolution camera (12.3Mp at 10fps and 3.1Mp at 33fps)
- Optional High speed camera (0.4Mp at 350fps and 0.02Mp at 1000fps)
- 12 position filter wheel as standard
- Measures both PAM and OJIP
- Actinic light up to 2.000 µmoll (white, red, blue and far-red)
- Saturation pulse up to 20.000 µmoll (450nm)
- 12.3Mp Color and multispectral images
- User interface controlled software (no programming needed)
- FREE analysis software


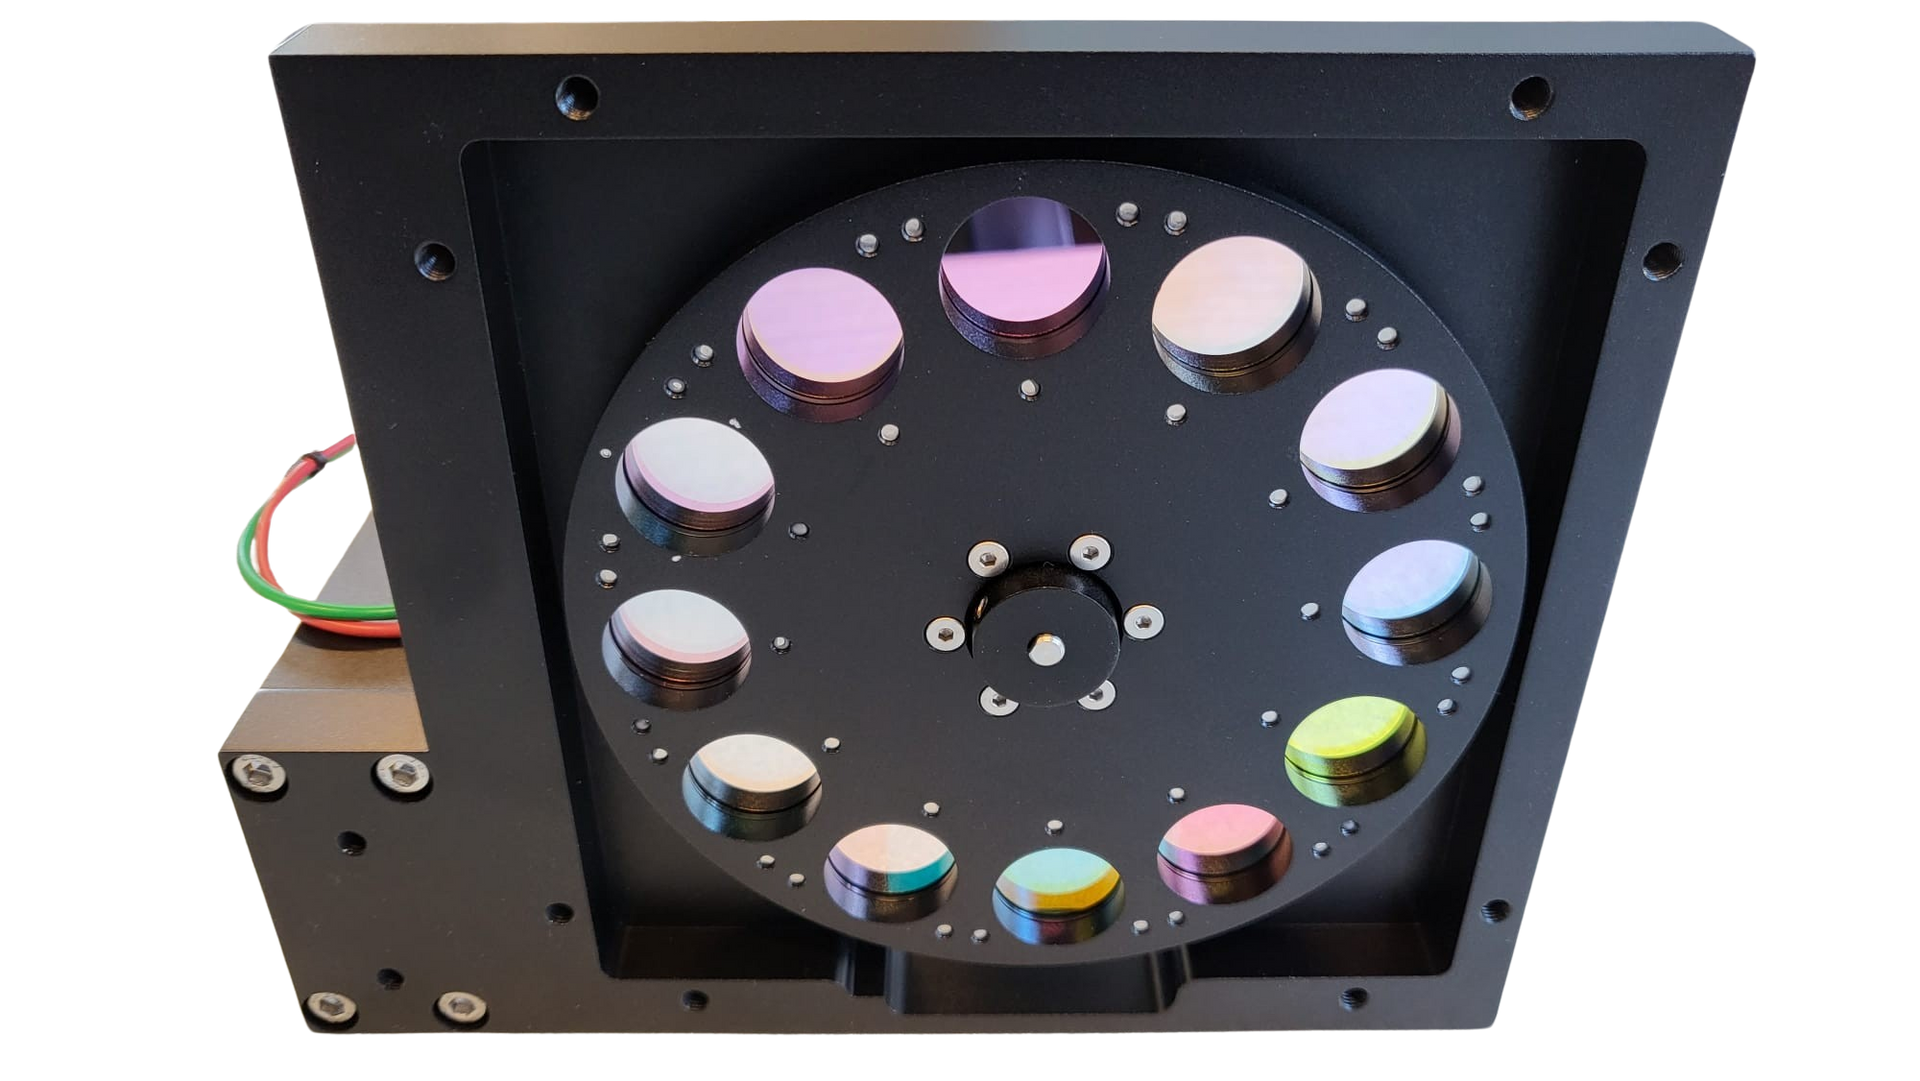
12 Position Filter Wheel
The PlantExplorer MAX+ comes equipped with a 12-position filter wheel. By default, it includes 7 standard filters, with the option to add more based on customer requirements. Combined with various excitation sources, this allows for the collection of a wide range of images to meet diverse research needs.
Installed filters by default
475nm
540nm
550nm
640nm
710nm
730nm
770nm
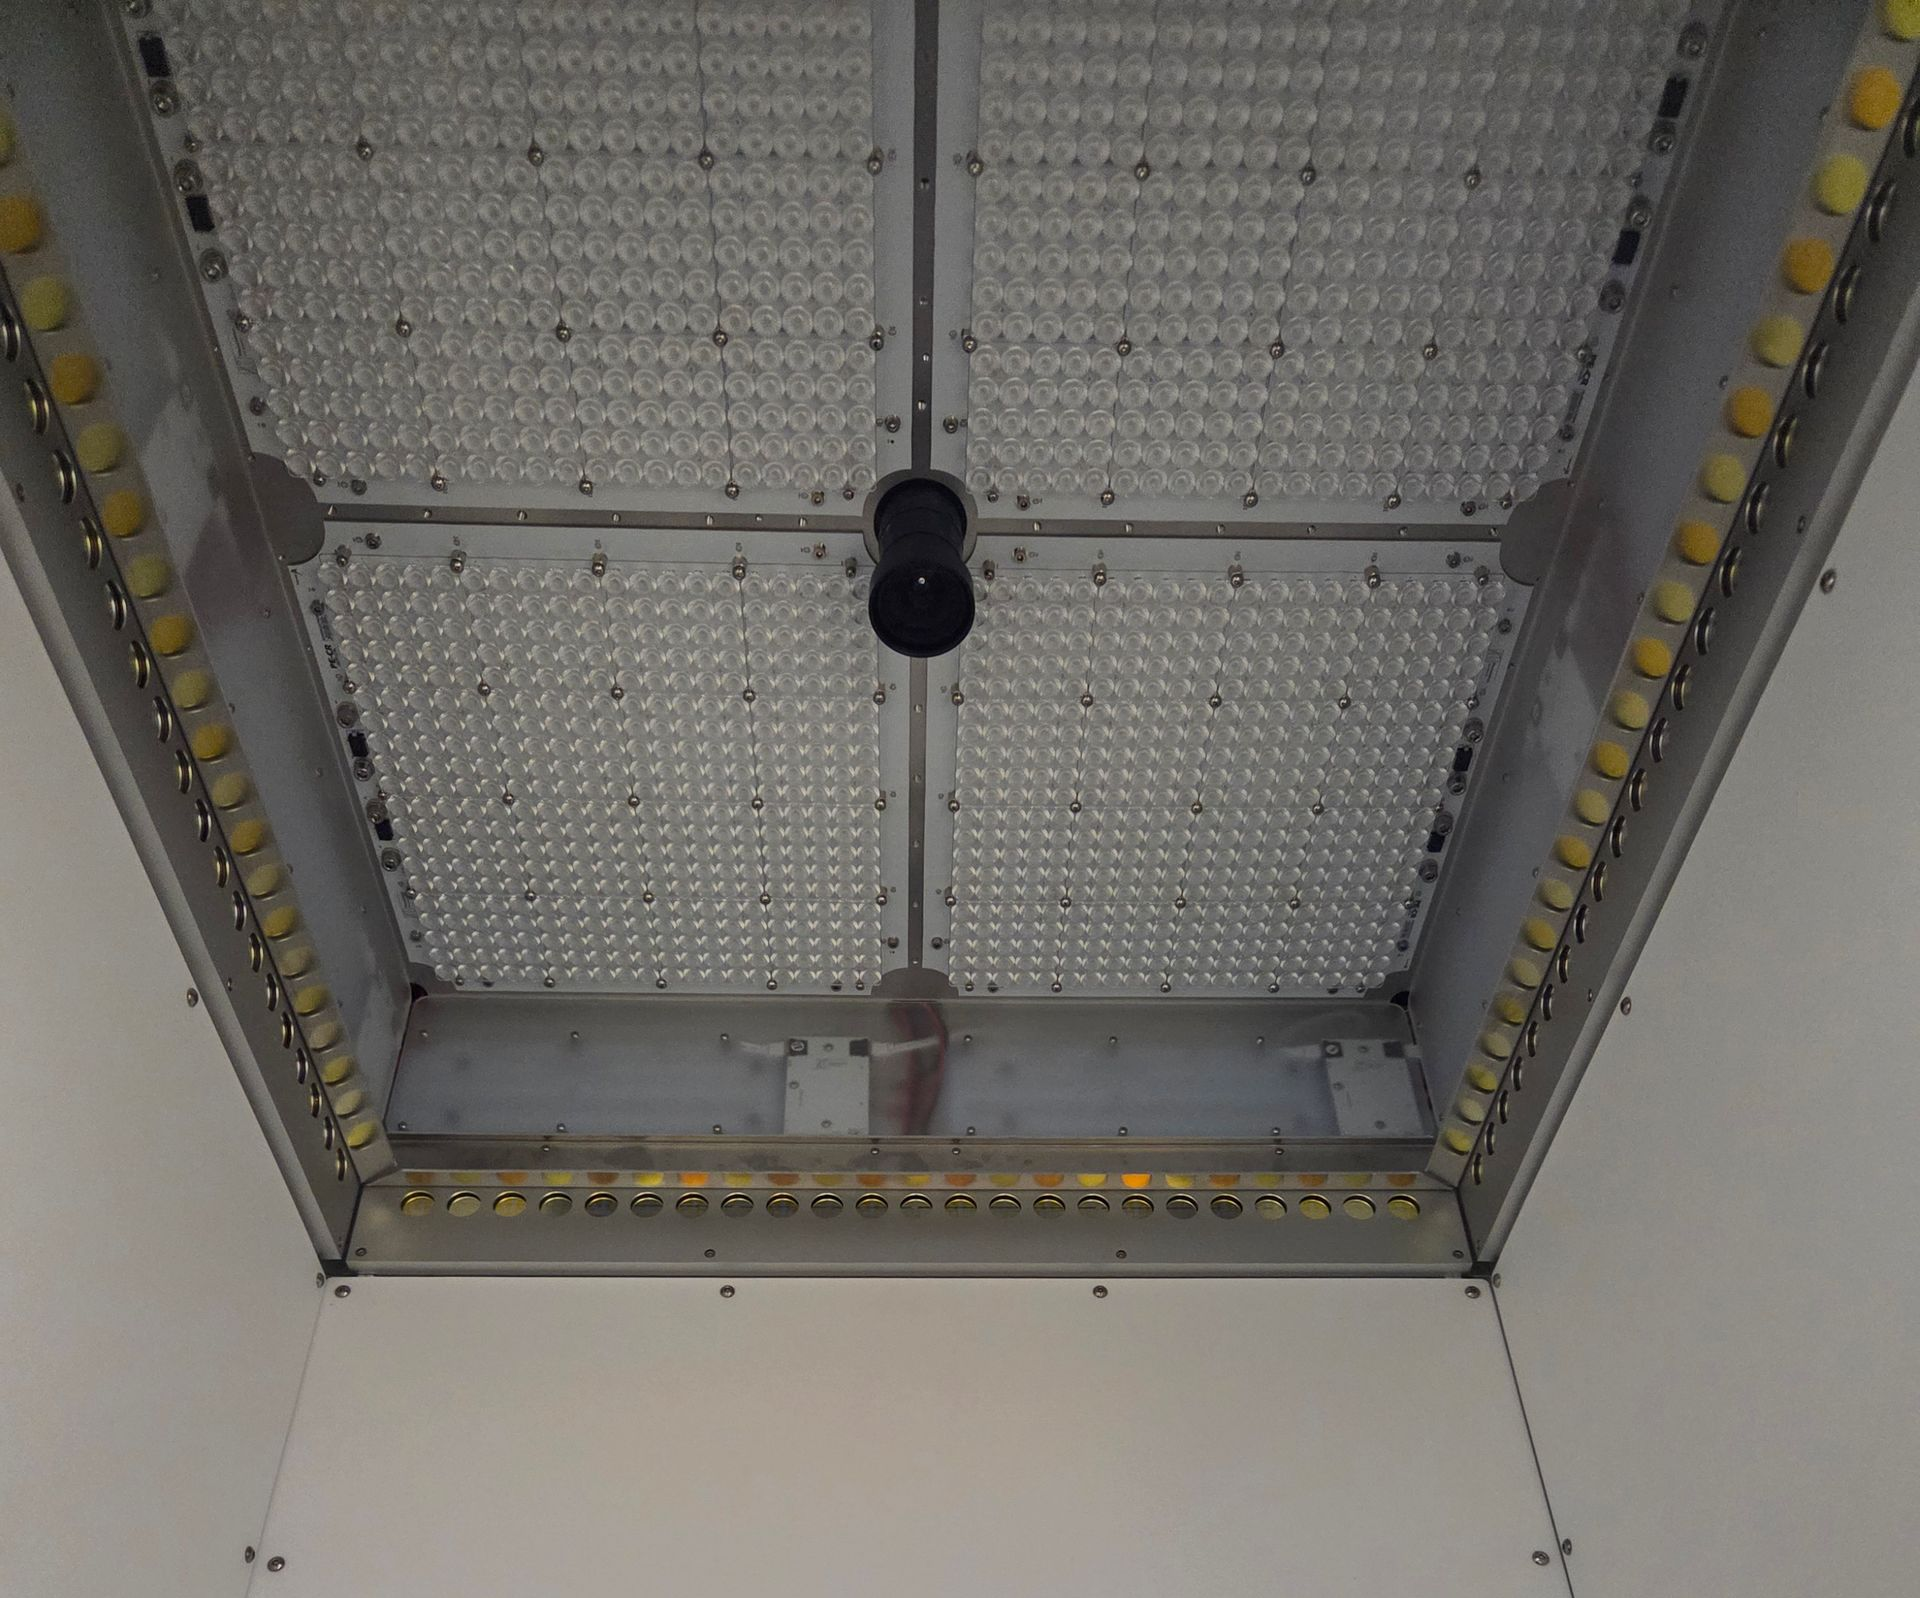
Excitation sources
The PlantExplorer MAX+ has a state-of-the-art 4-channel multispectral LED system. This advanced lighting setup includes two channels of White, Red, Blue and Far Red.
This versatile LED configuration allows for precise control over the light spectrum, enabling detailed studies of plant responses to different wavelengths.
The LED ceiling for imaging chlorophyll fluorescence parameters is composed of two Blue LED strings: one dedicated to the measuring pulse and the other for the saturation pulse.
Optional the PlantExplorer MAX+ can be equipped with an additional Dual GFP LED ring or a GFP/RFP LED ring. Each LED is meticulously filtered to prevent any emission leakage. Additionally, these LED rings can be customized to meet any specific excitation LED requirements of the customer.
Available spectrum
3000K
420nm
660nm
730nm
450nm
450nm
405nm
470nm
530nm
The science behind our cameras
PAM
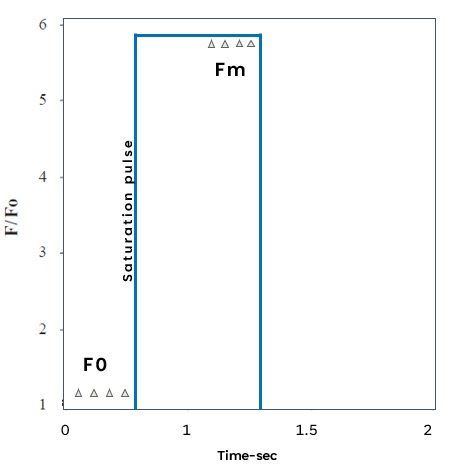
PAM fluorometry is a powerful technique that assesses the efficiency of Photosystem II (PSII) by measuring variable chlorophyll fluorescence. This method provides insights into how light energy is utilized during photosynthesis and other processes.
The process involves using light pulses to analyze fluorescence emitted by chlorophyll, the pigment responsible for capturing light energy. Minimal fluorescence (Fo) is measured when all PSII reaction centers are open, while maximal fluorescence (Fm) is recorded when these centers are closed. The difference between these two measurements, known as variable fluorescence (Fv), indicates the efficiency of PSII.
OJIP
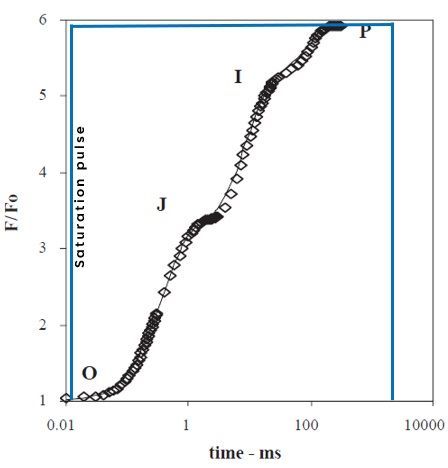
The OJIP curve is an advanced method for analyzing photosynthetic efficiency, providing deeper insights than traditional PAM fluorometry. By measuring additional parameters, the OJIP curve offers a more detailed view of how light energy is used in photosynthesis.
This technique involves capturing the fluorescence emission of chlorophyll in response to a saturating light pulse, creating a curve with four distinct phases: O, J, I, and P. Each phase represents different states of the photosynthetic apparatus, from the initial energy capture to the complete reduction of the electron transport chain.
Chlorophyll Index
Our Chlorophyll-Index measurement is based on the formulas developed by A. Gitelson. This is achieved by interchanging filters in front of the camera to measure the Near-Infrared (NIR) and Red-edge spectra. By analyzing these spectra, the Chlorophyll Index is calculated.
The Chlorophyll Index is an excellent parameter for plant phenotyping because it allows for the rapid detection of chlorophyll retraction. This method is significantly faster than waiting for visual changes in leaf color to light green or yellow, providing quicker and more accurate insights into plant health.
Anthocyanin Index
Our Anthocyanin-Index measurement is based on the formulas developed by A. Gitelson. This is achieved by interchanging filters in front of the camera to measure specific spectra. By analyzing these spectra, the Anthocyanin Index is calculated.
The Anthocyanin Index is an excellent parameter for plant phenotyping because it allows for the rapid detection of anthocyanin levels. This method is significantly faster than waiting for visual changes in leaf coloration, providing quicker and more accurate insights into plant health and stress responses.
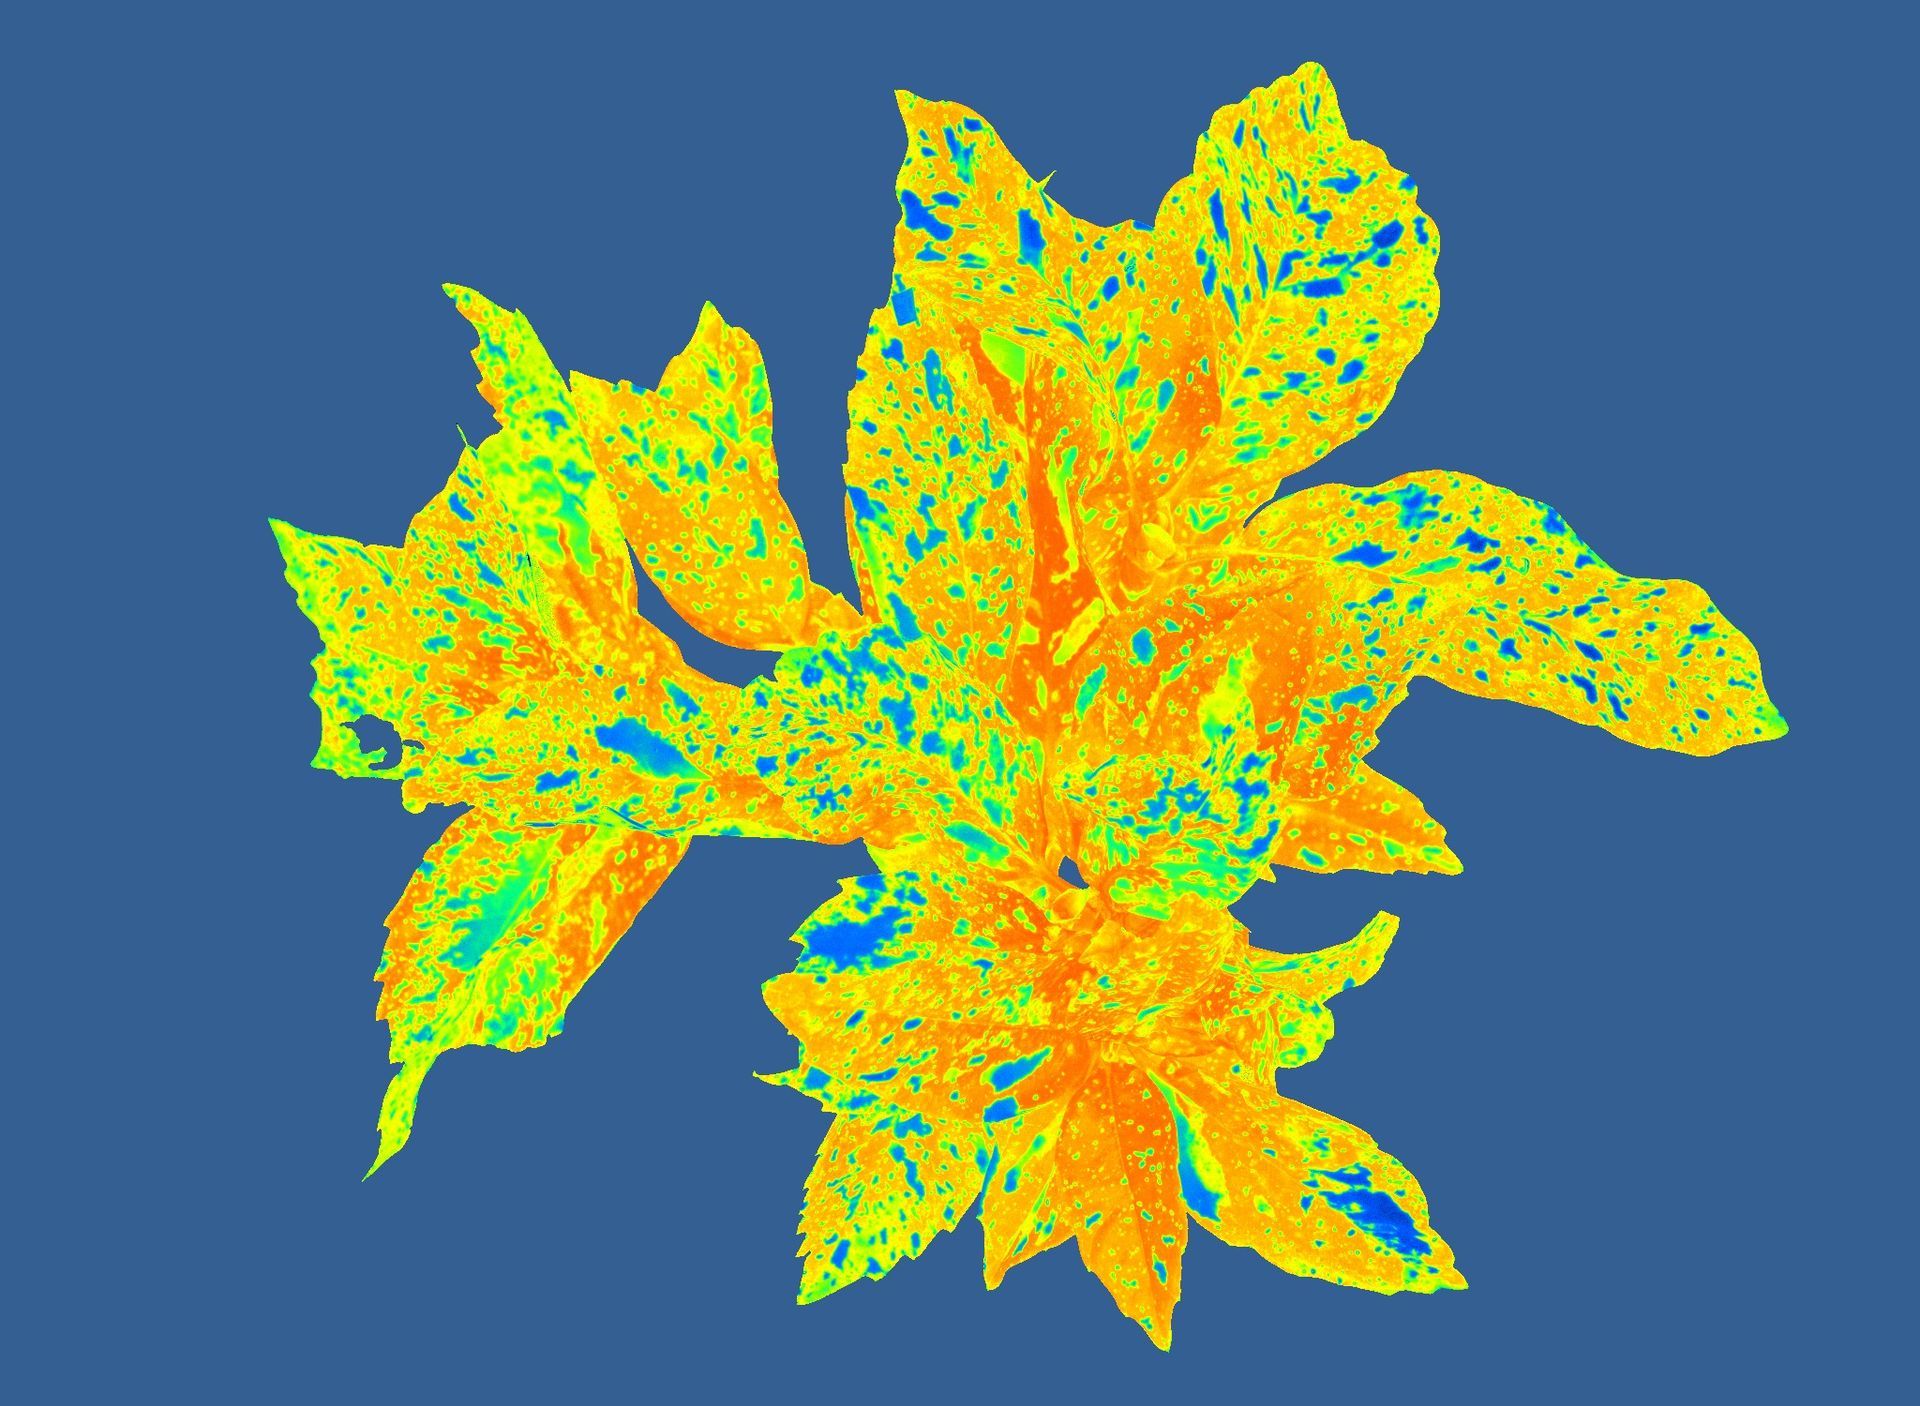
NDVI
The PlantExplorer MAX+ enables precise measurement of NDVI (Normalized Difference Vegetation Index). NDVI is determined by imaging the NIR (near-infrared) and RED reflections of a plant. By applying a false color table, we visualize the results: blue indicates low NDVI values, while red signifies high NDVI values.
Alpha
The PlantExplorer MAX+ measures the chlorophyll absorption (alpha) by measuring the reflection at 730nm and 660nm.
This measurement is essential for calculating Electron Transport Rate (ETR), indicating photosynthetic efficiency.
ETR=PAR×Abs×ΦPSII×0.5 (see measurement below)
ETR and NPQ
Both NPQ and ETR are essential for understanding a plant's photosynthetic performance. While ETR indicates the efficiency of energy conversion, NPQ reflects the plant's ability to manage and dissipate excess light. Together, they provide a comprehensive view of how plants balance energy absorption, conversion, and dissipation, ensuring optimal growth and resilience.
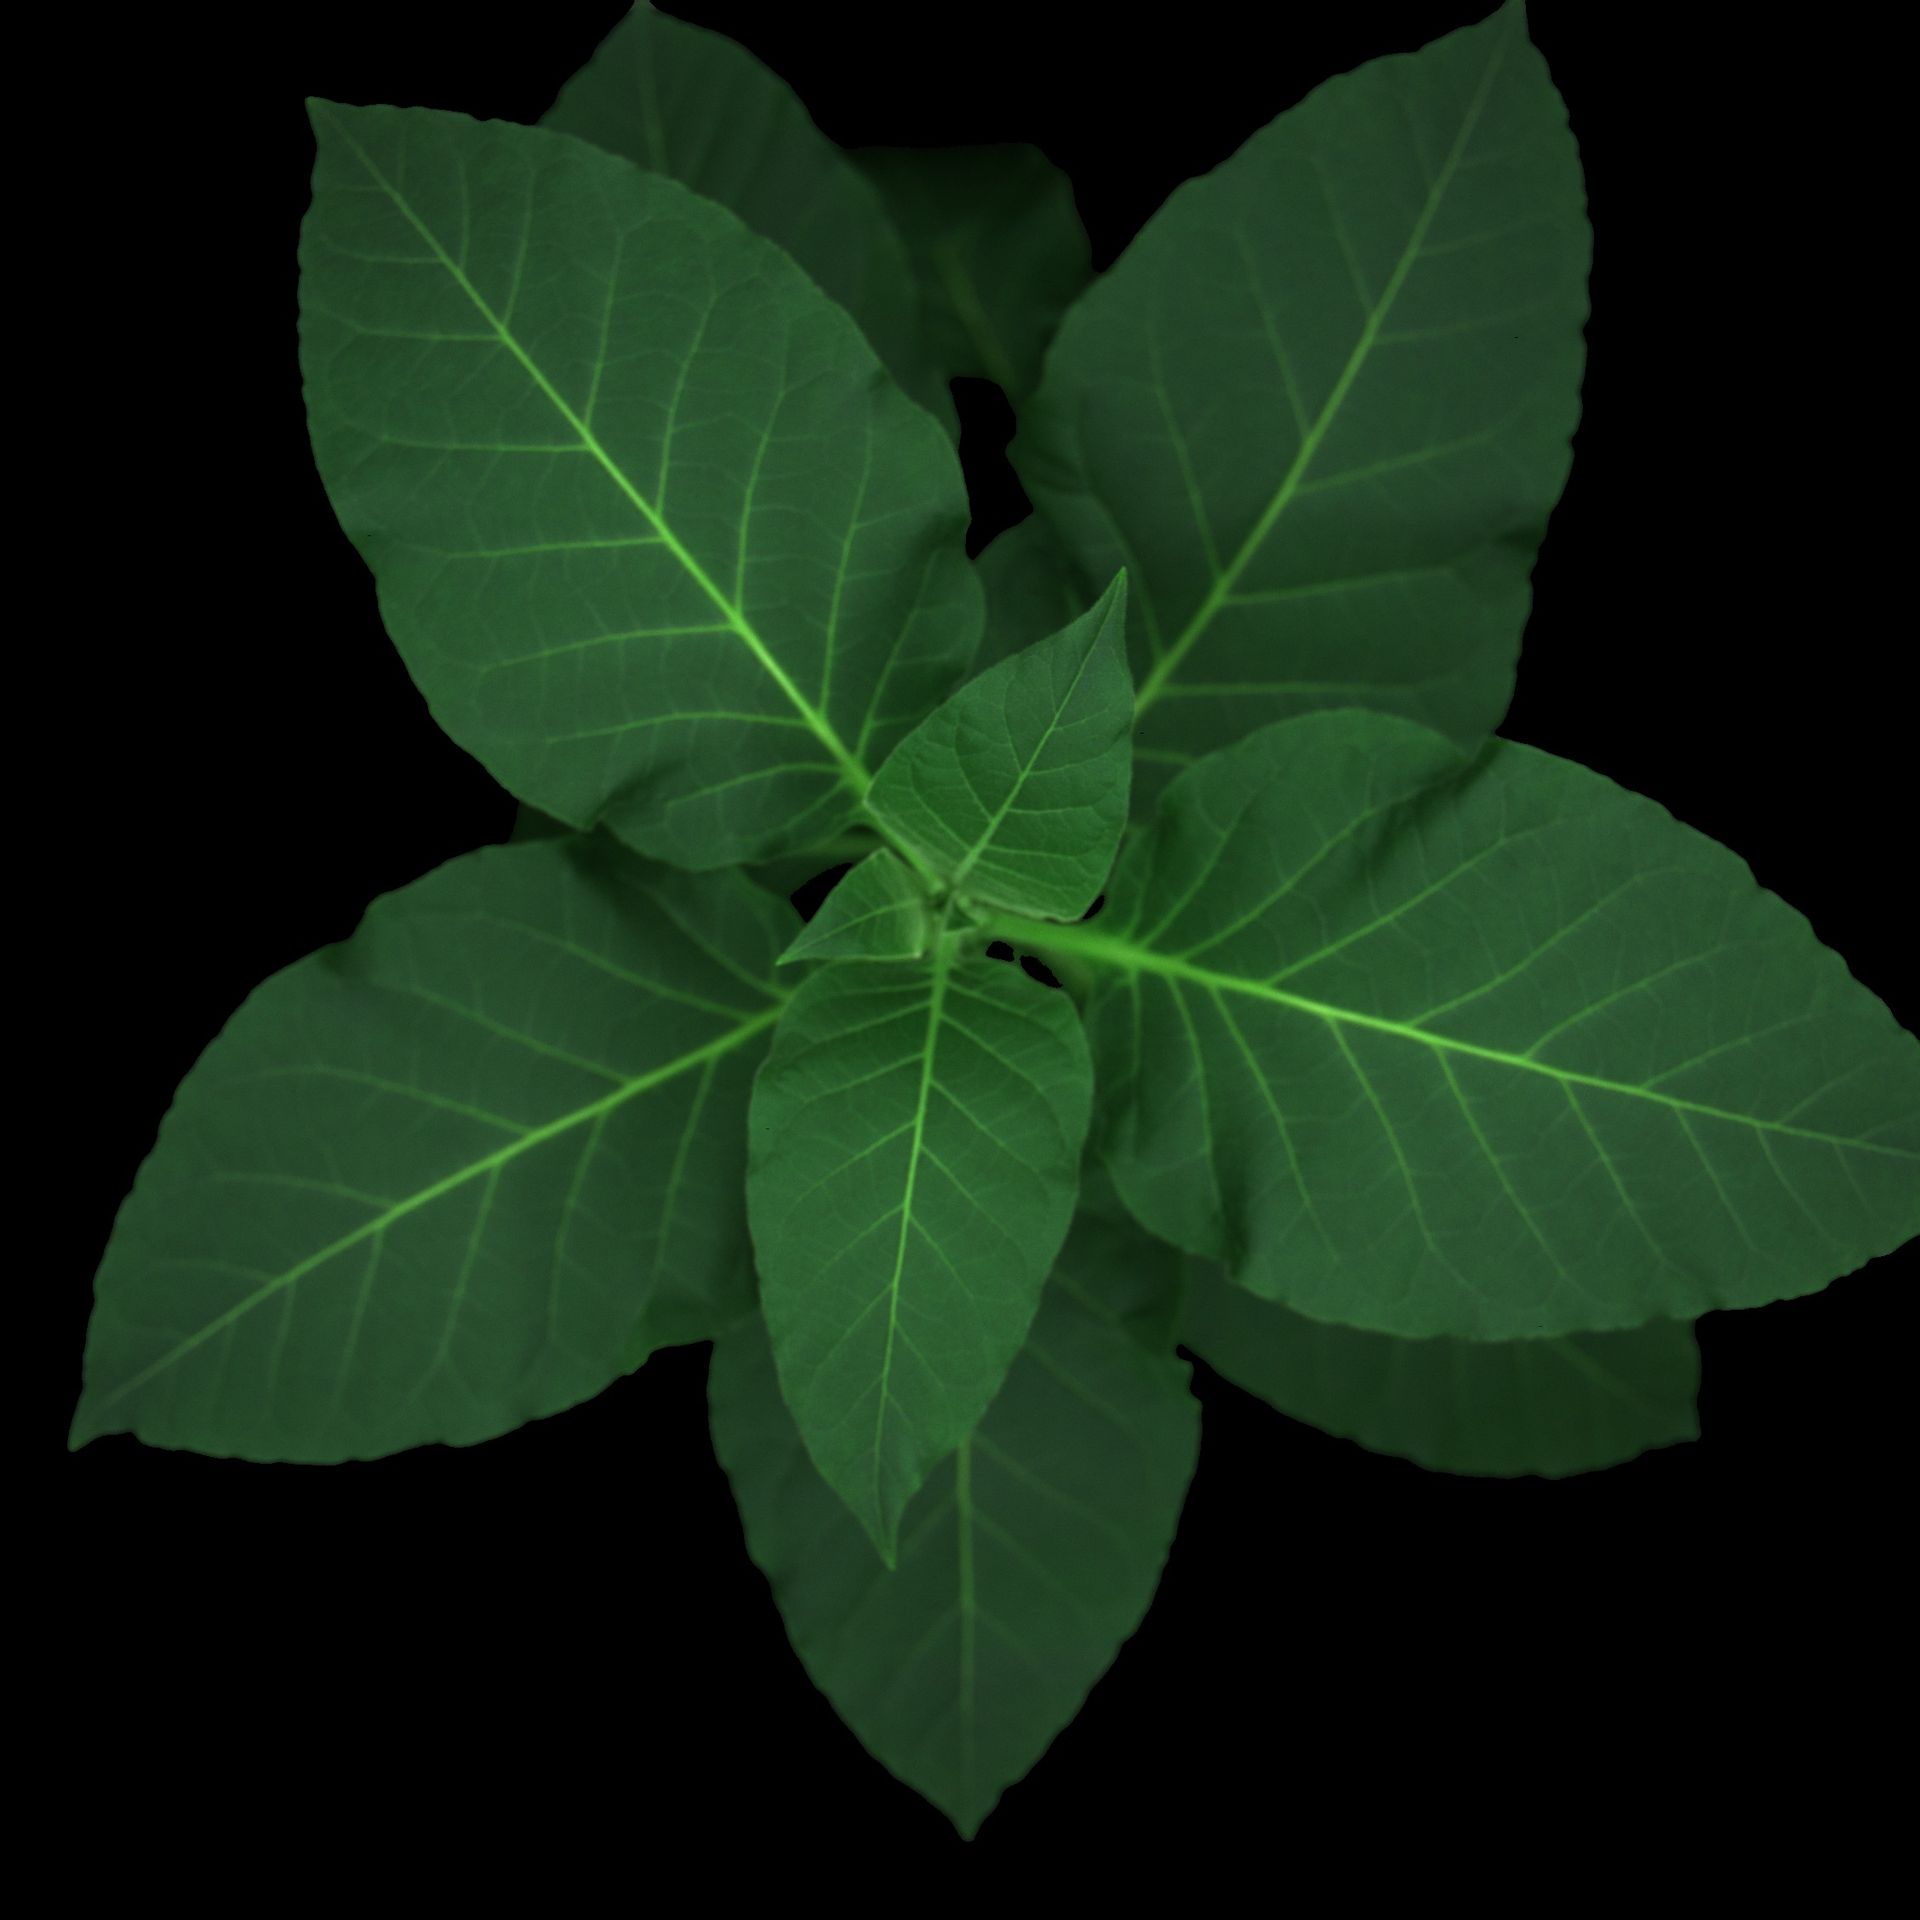
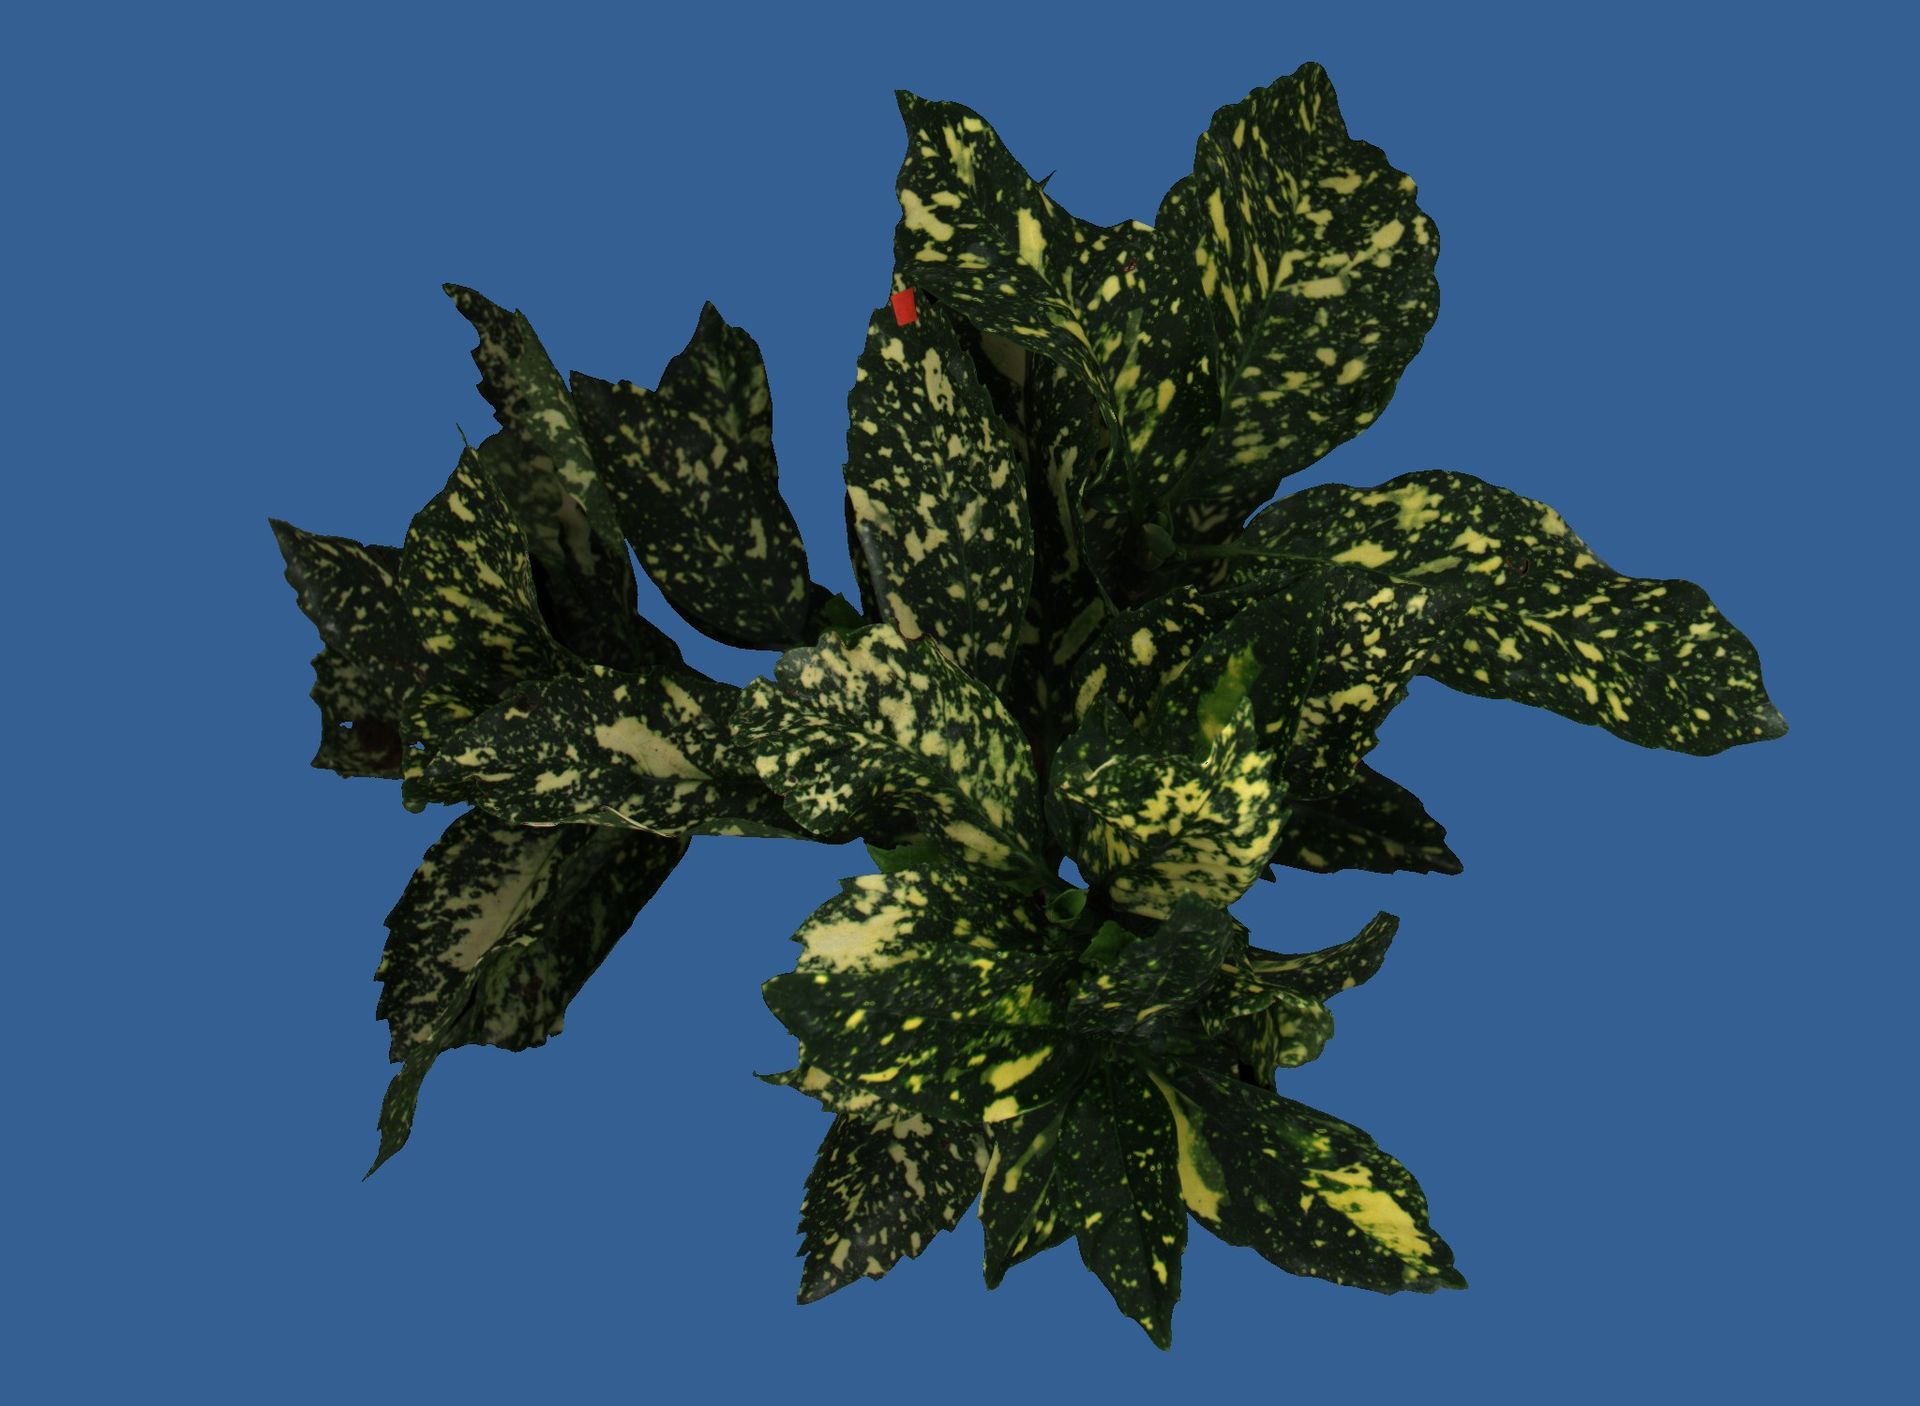
True color imaging
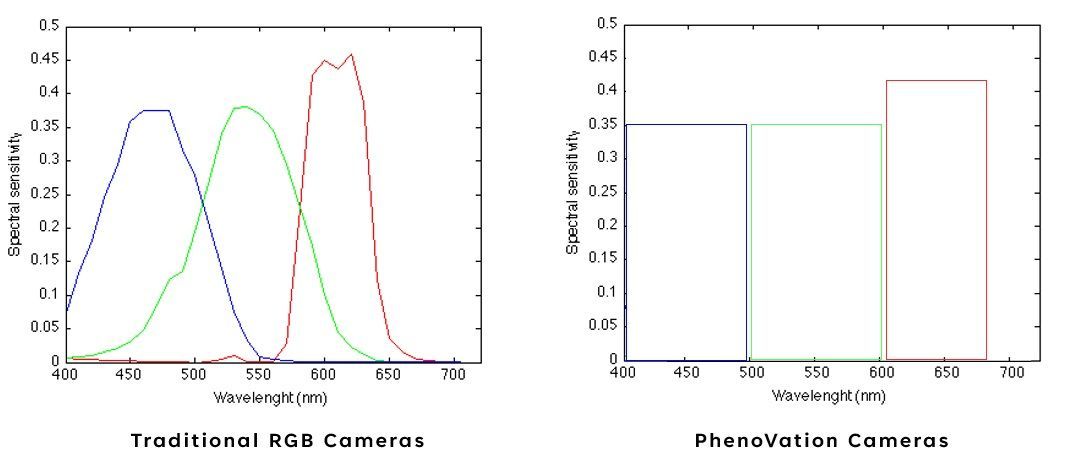
The PlantExplorer MAX+ uses three individual filters—red, green, and blue—to capture color images. Unlike conventional RGB cameras, which have filters directly applied to the pixels, our system ensures true color representation because all the pixels are used for each filter..
Standard RGB cameras, such as a 12MP model, typically have 3MP for red and blue pixels and 6MP for green pixels. Each pixel is then interpolated to create a color image, and overlapping filters require debayering, which can introduce errors.
In contrast, the PlantExplorer MAX+ does not require debayering, resulting in accurate true color images without the need for correction or interpolation, as illustrated in the graph below.
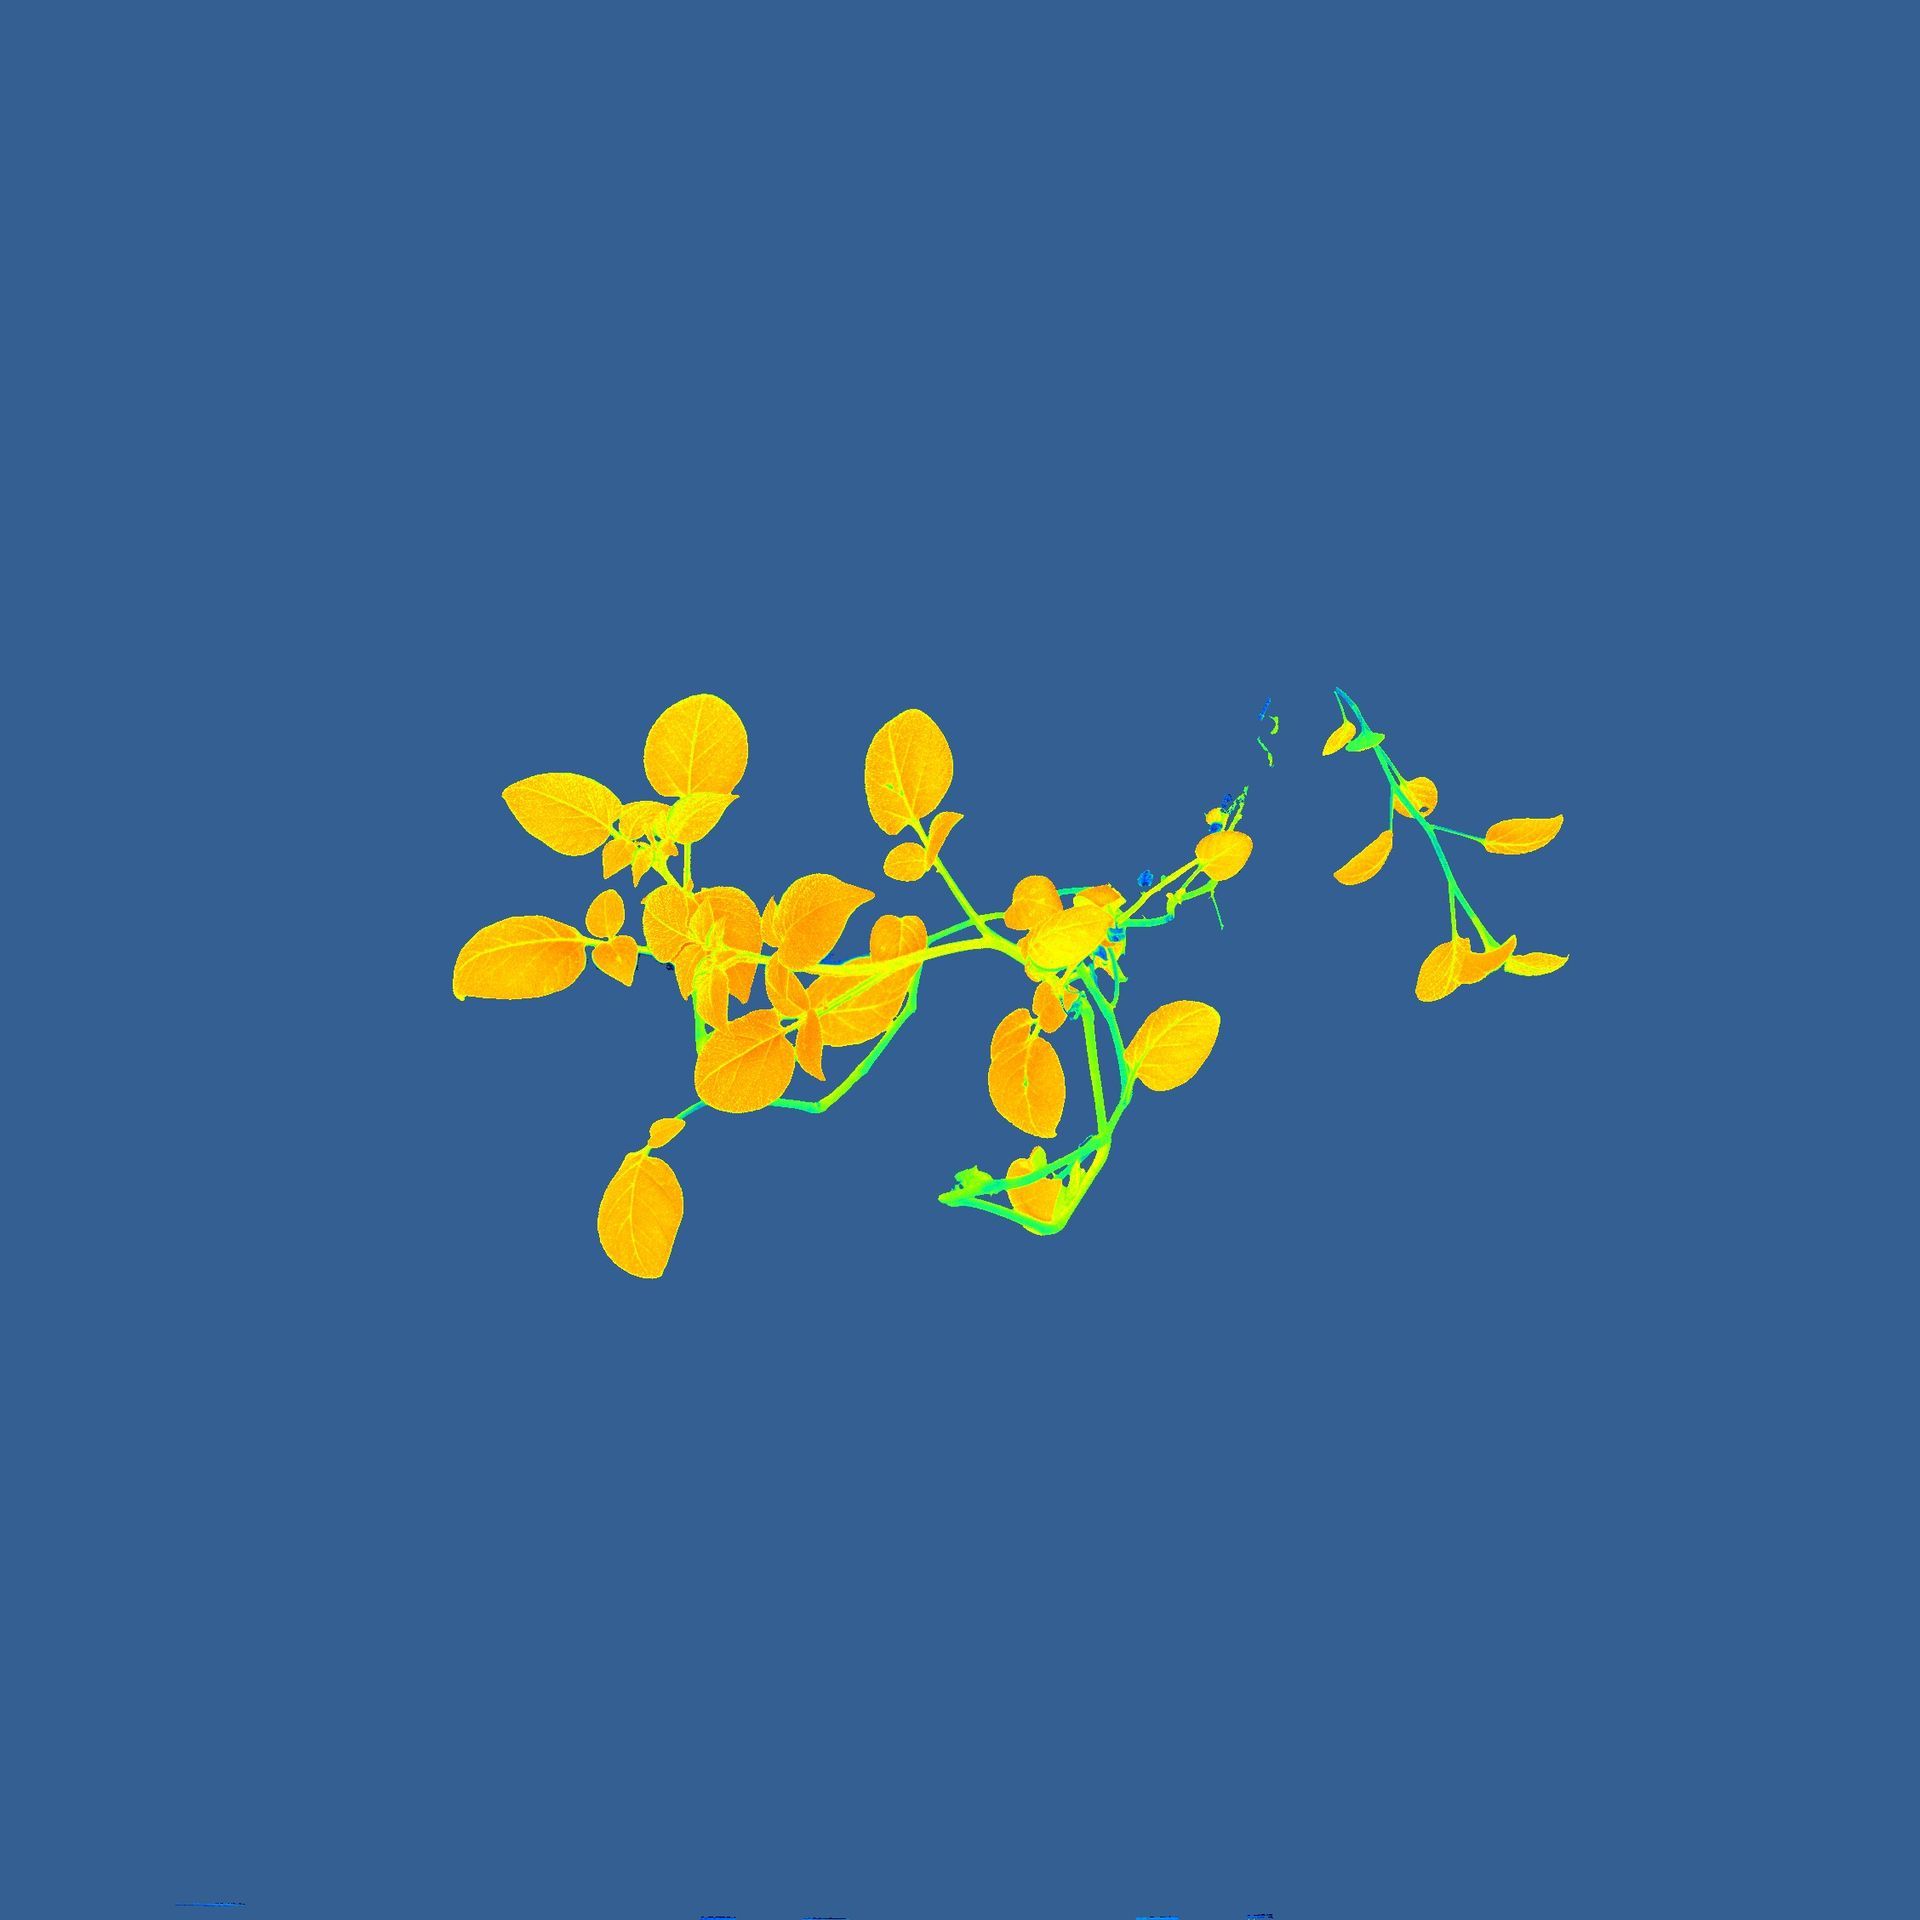
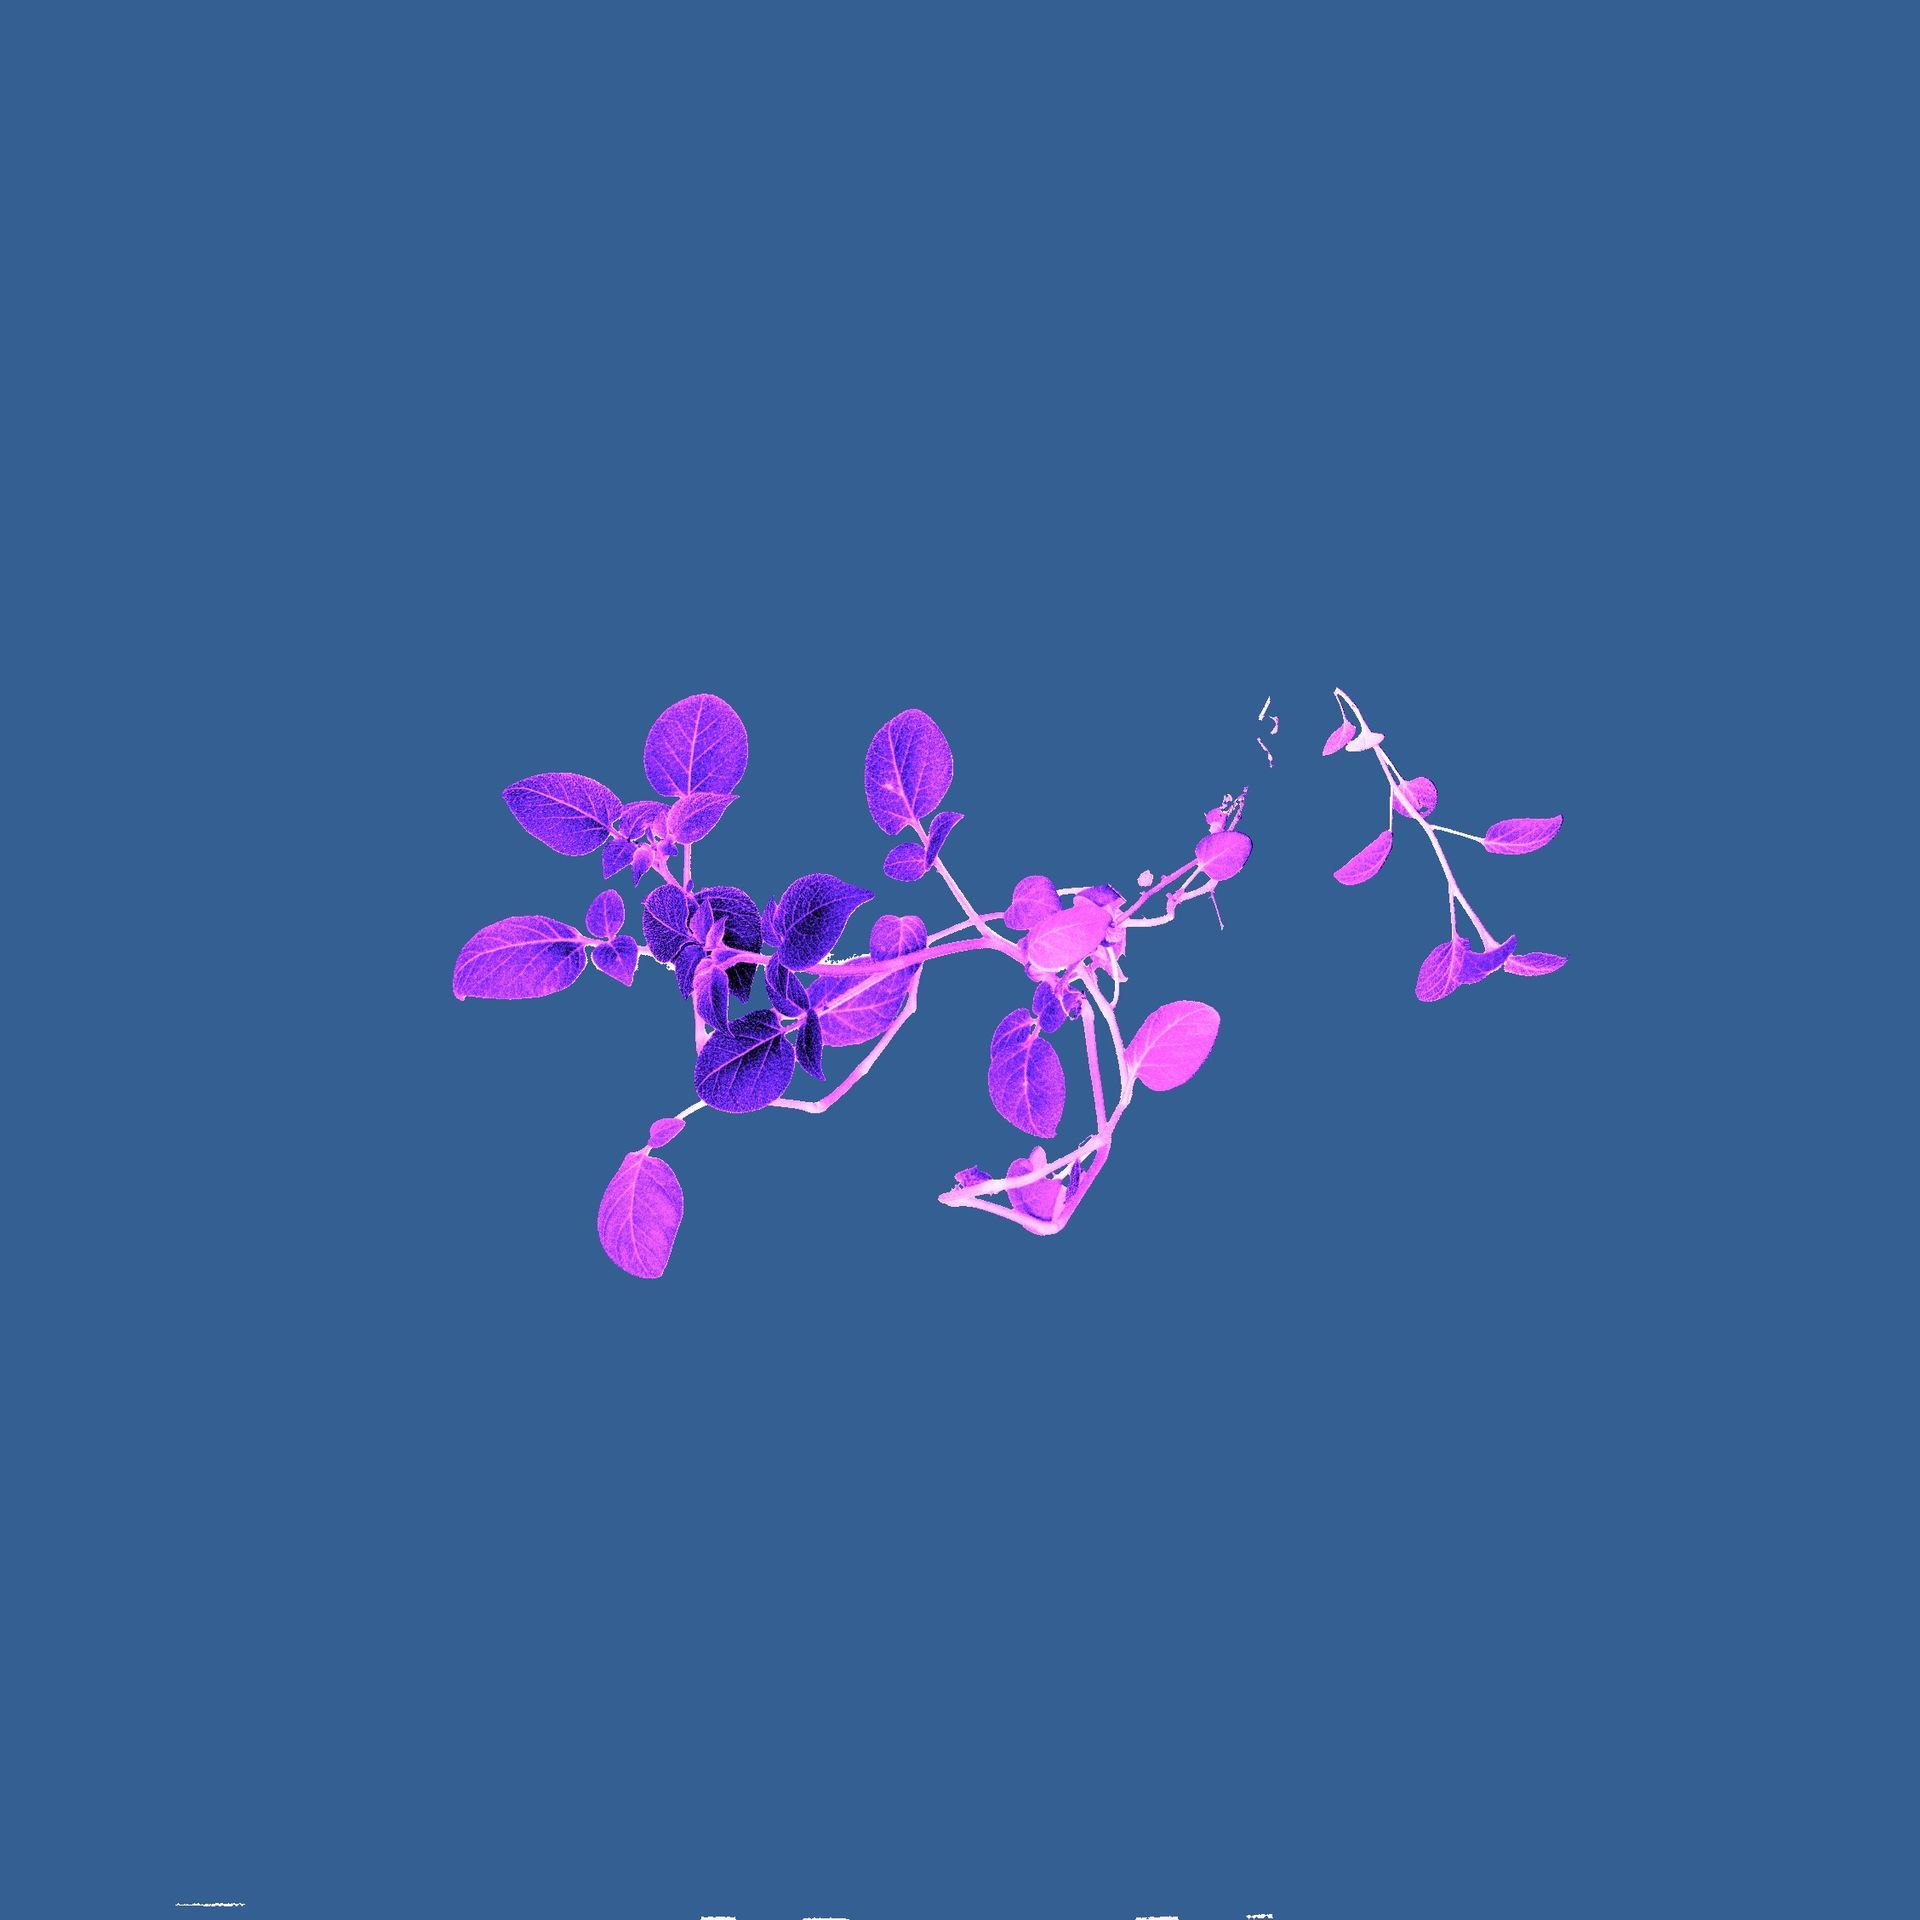
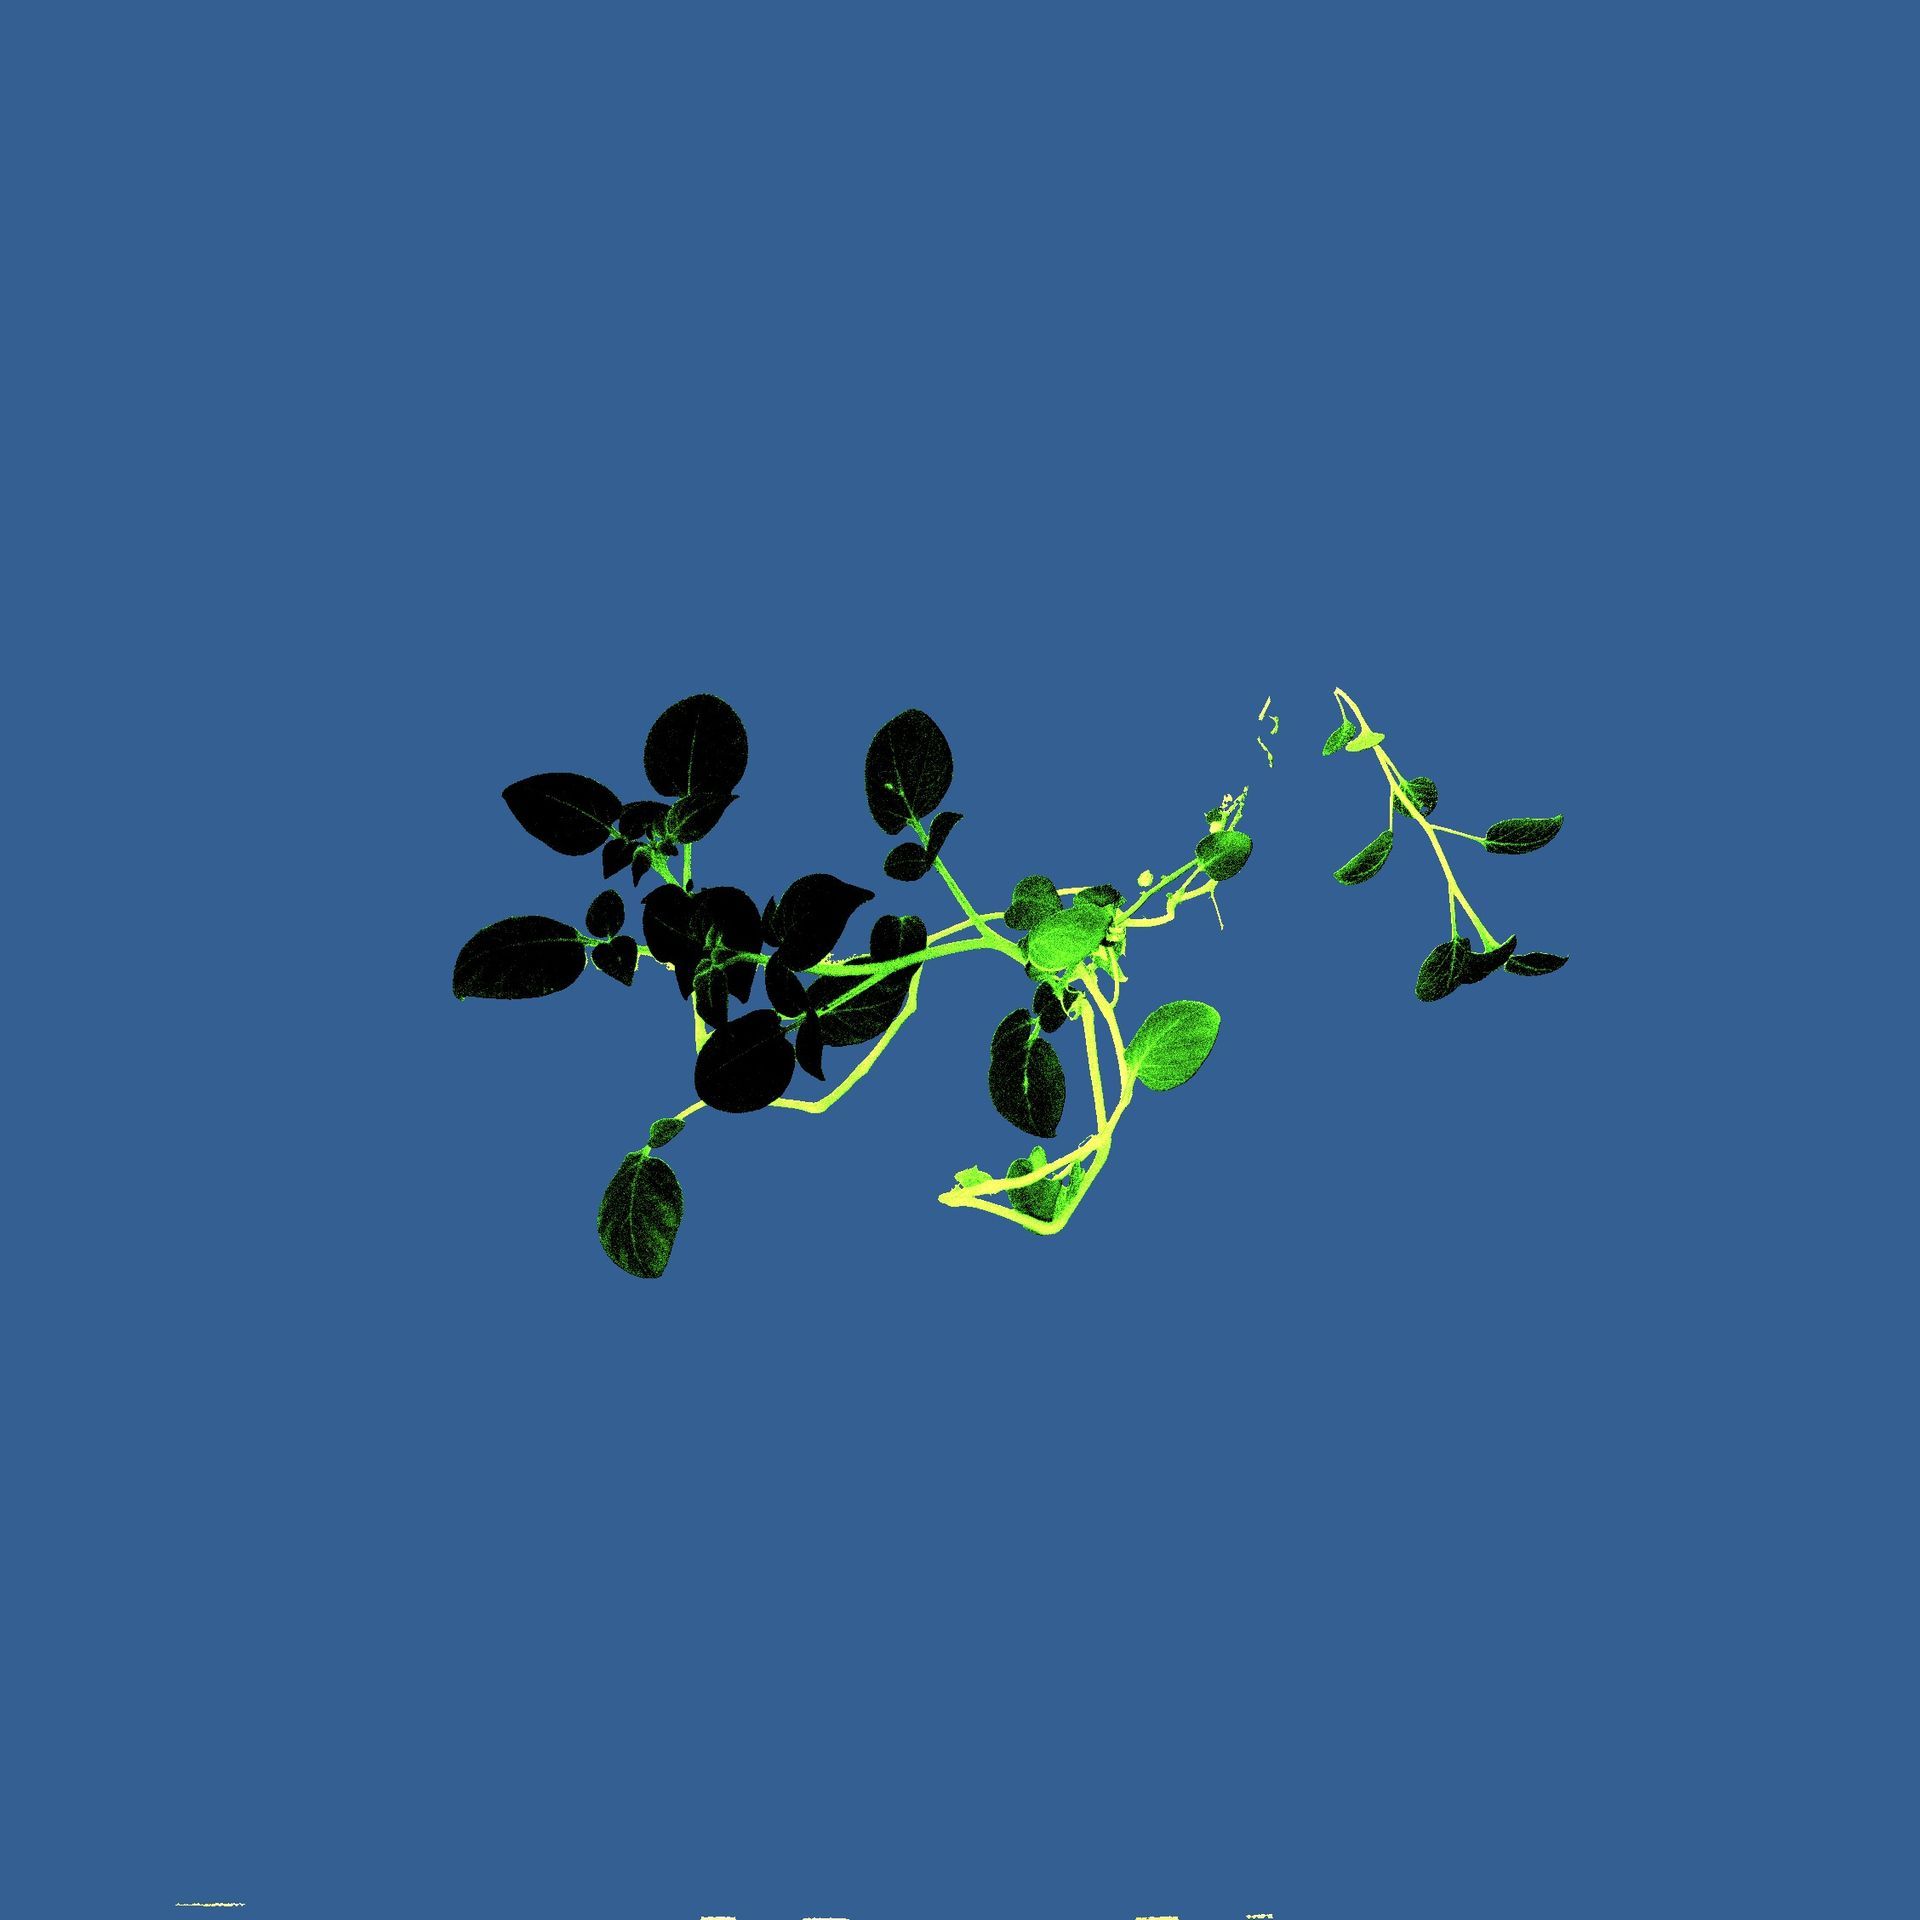
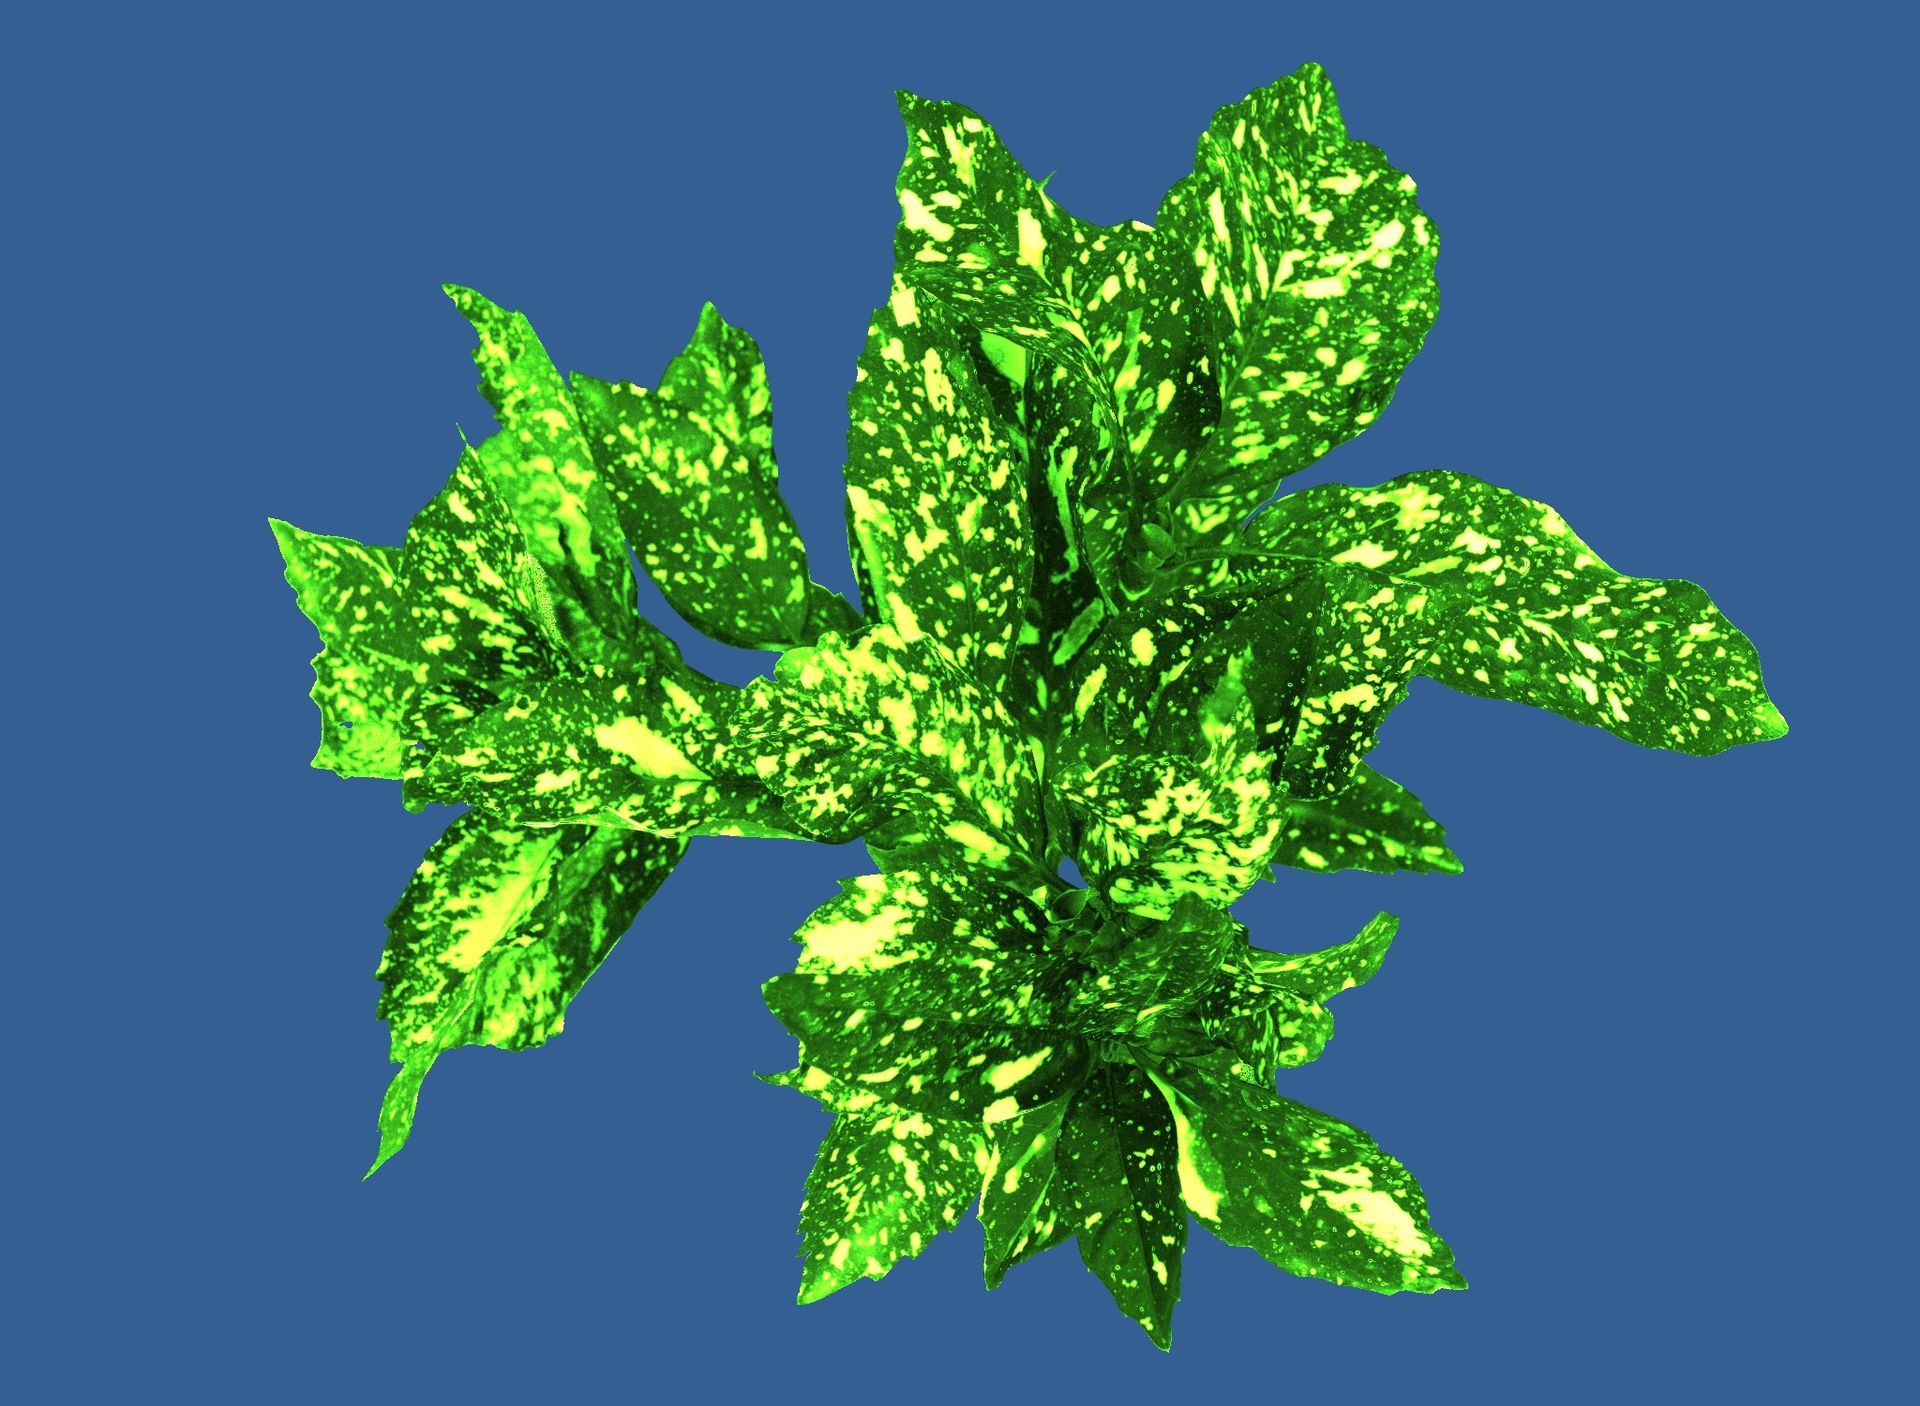
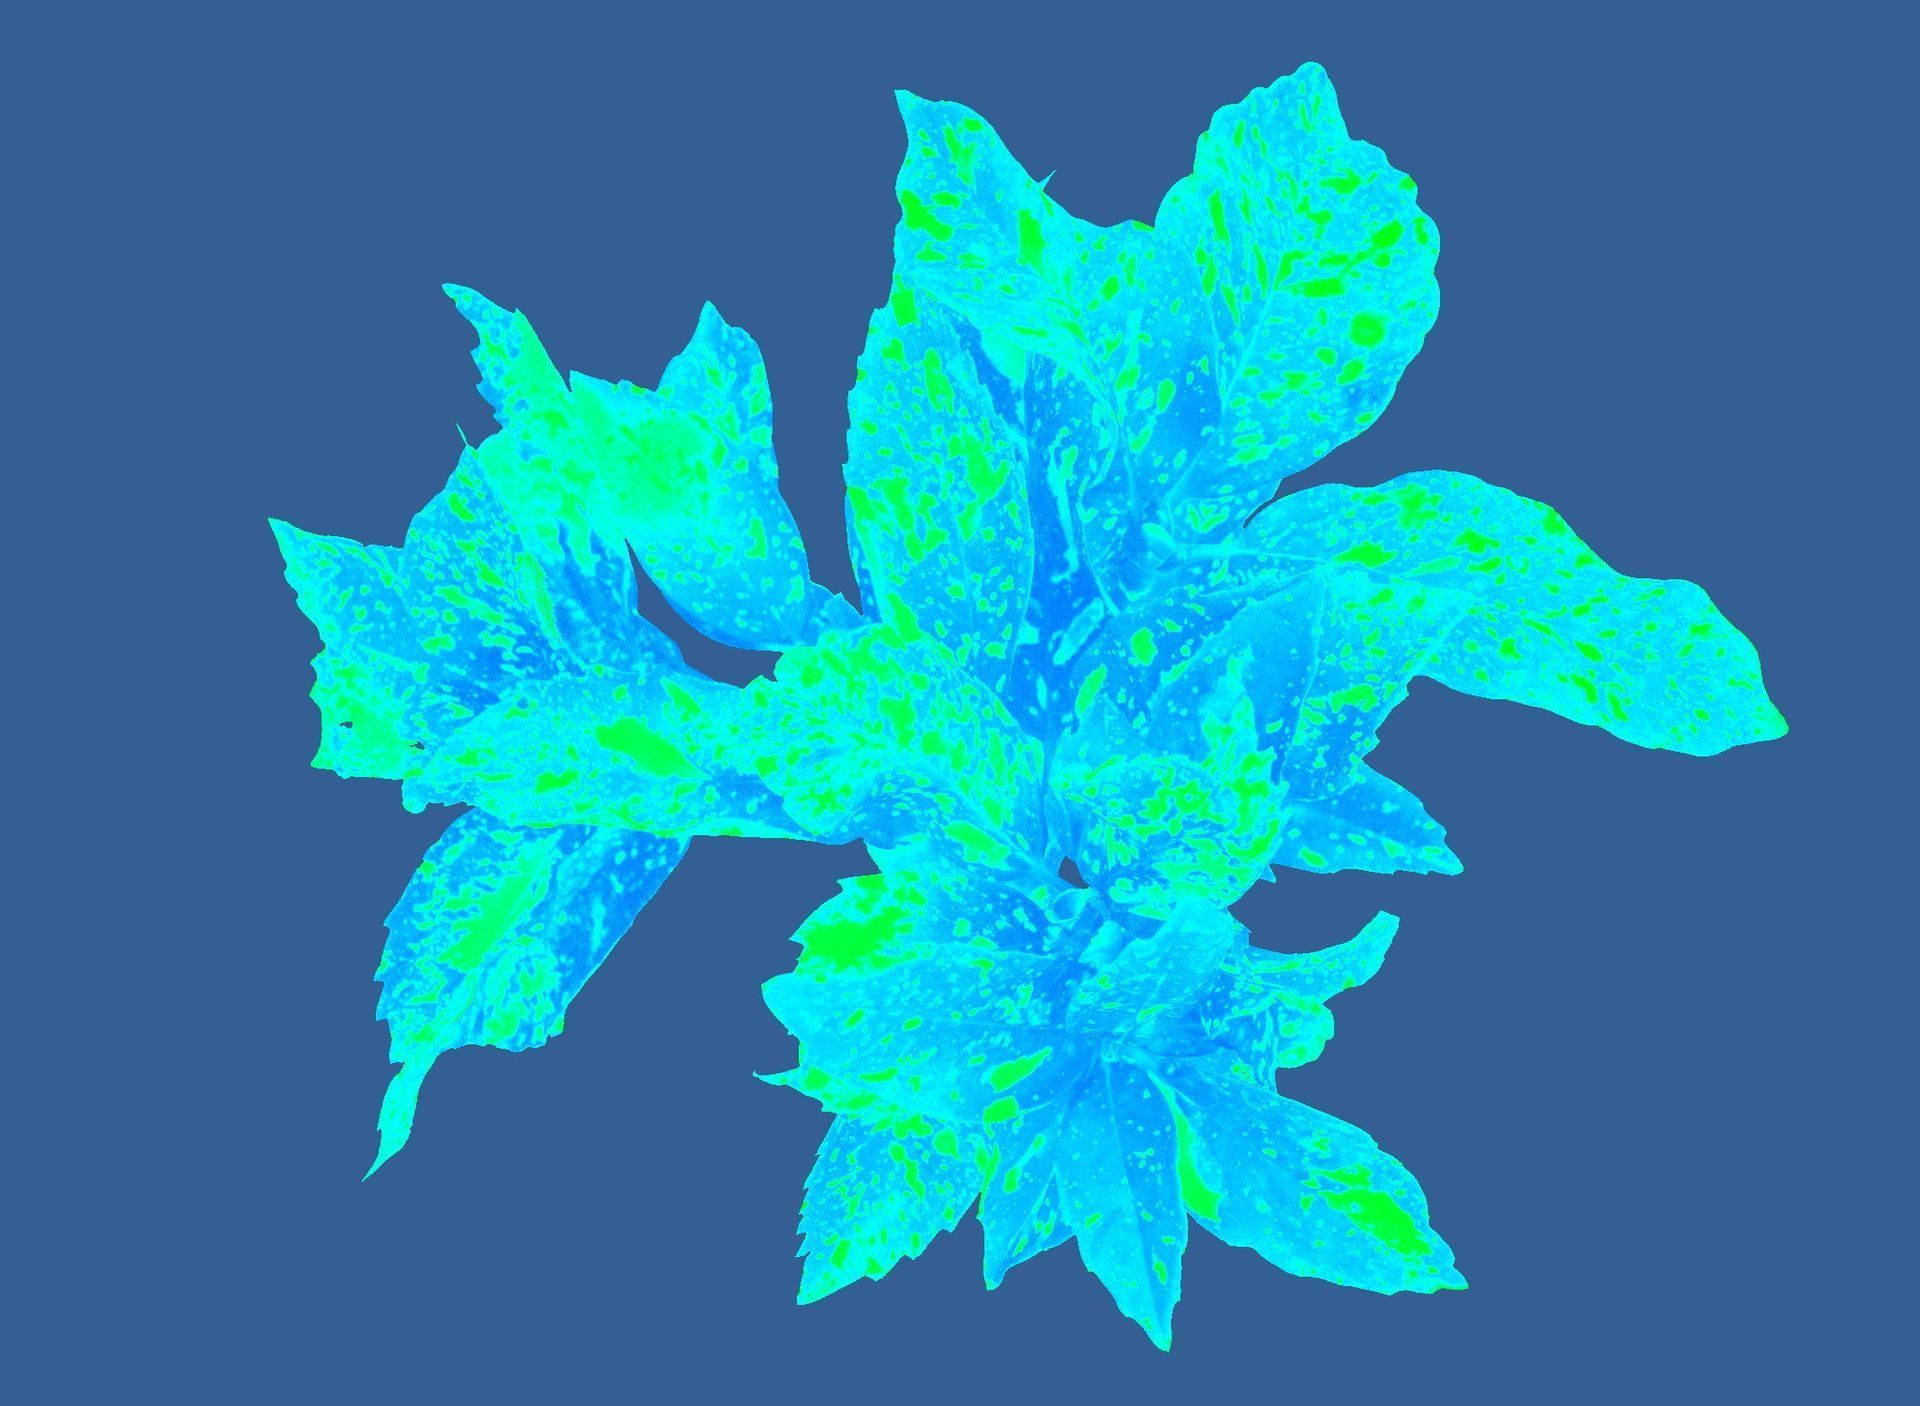
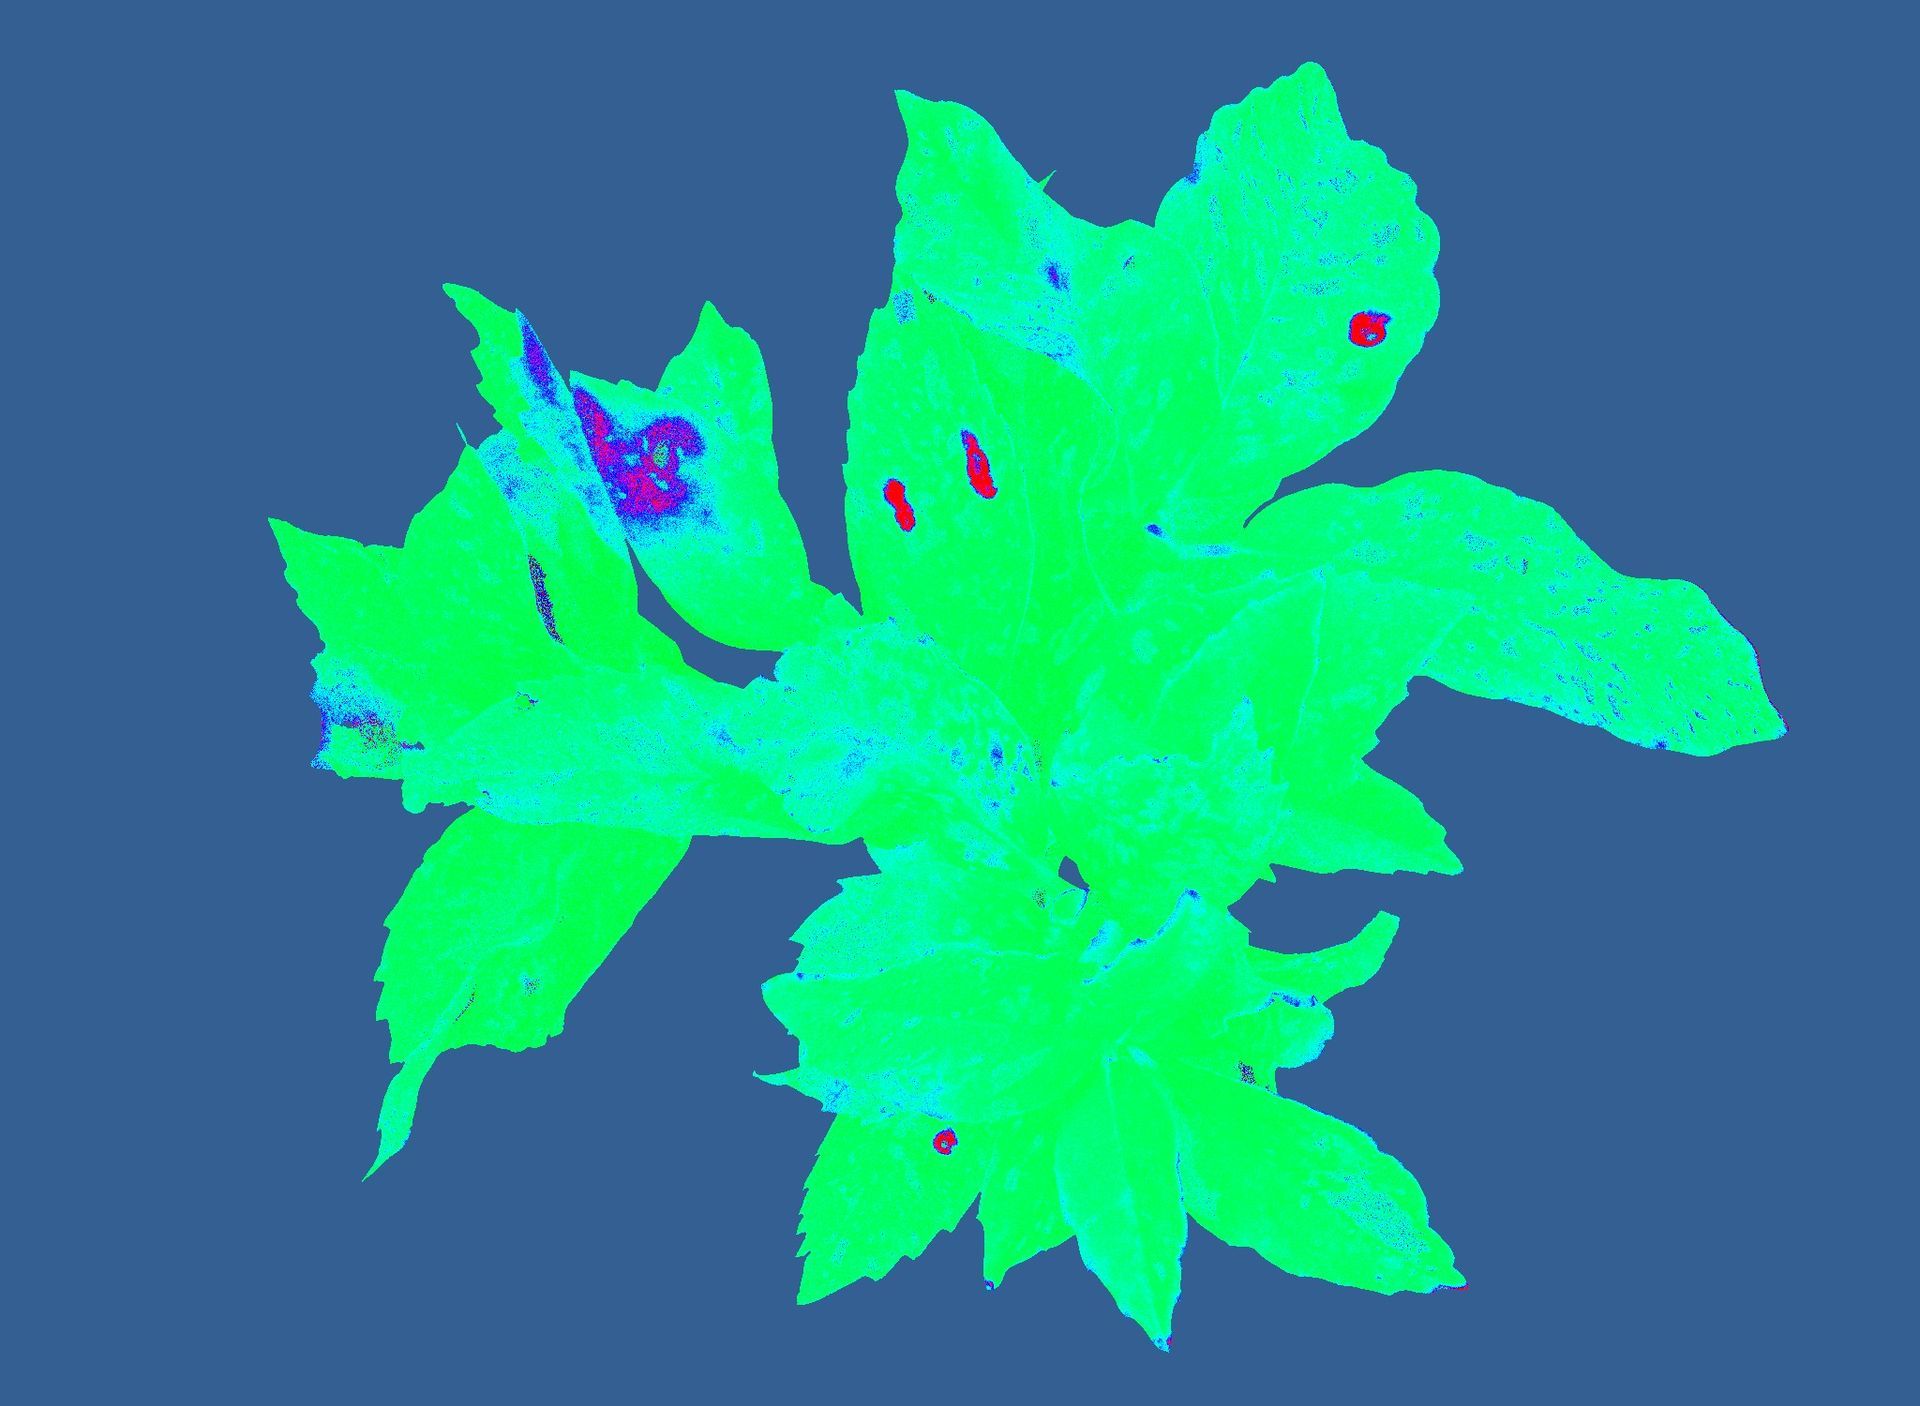
Measuring Dual GFP or GFP and RFP
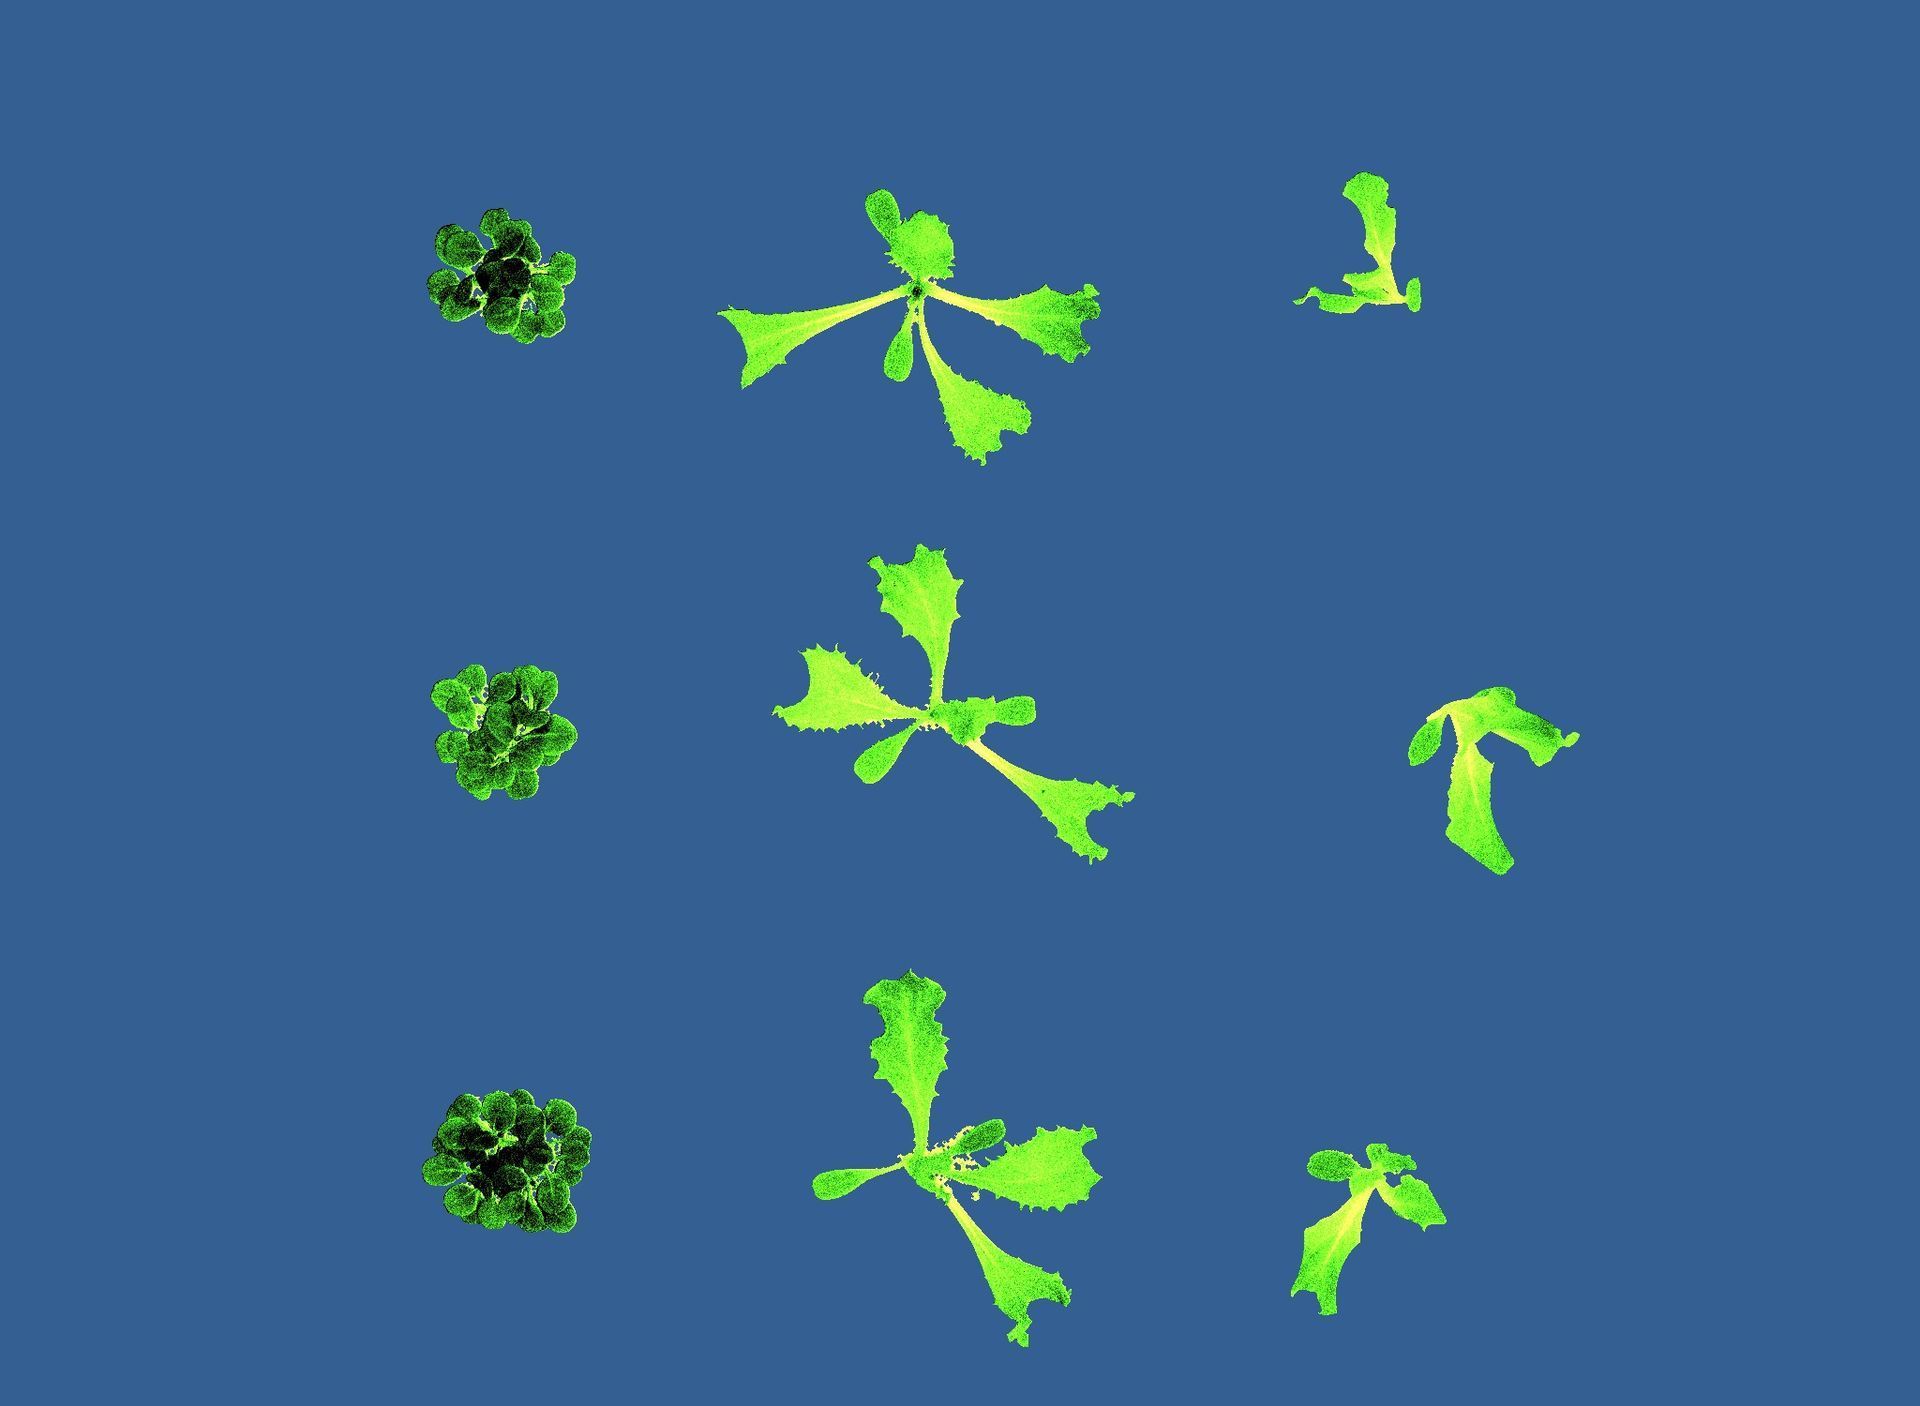
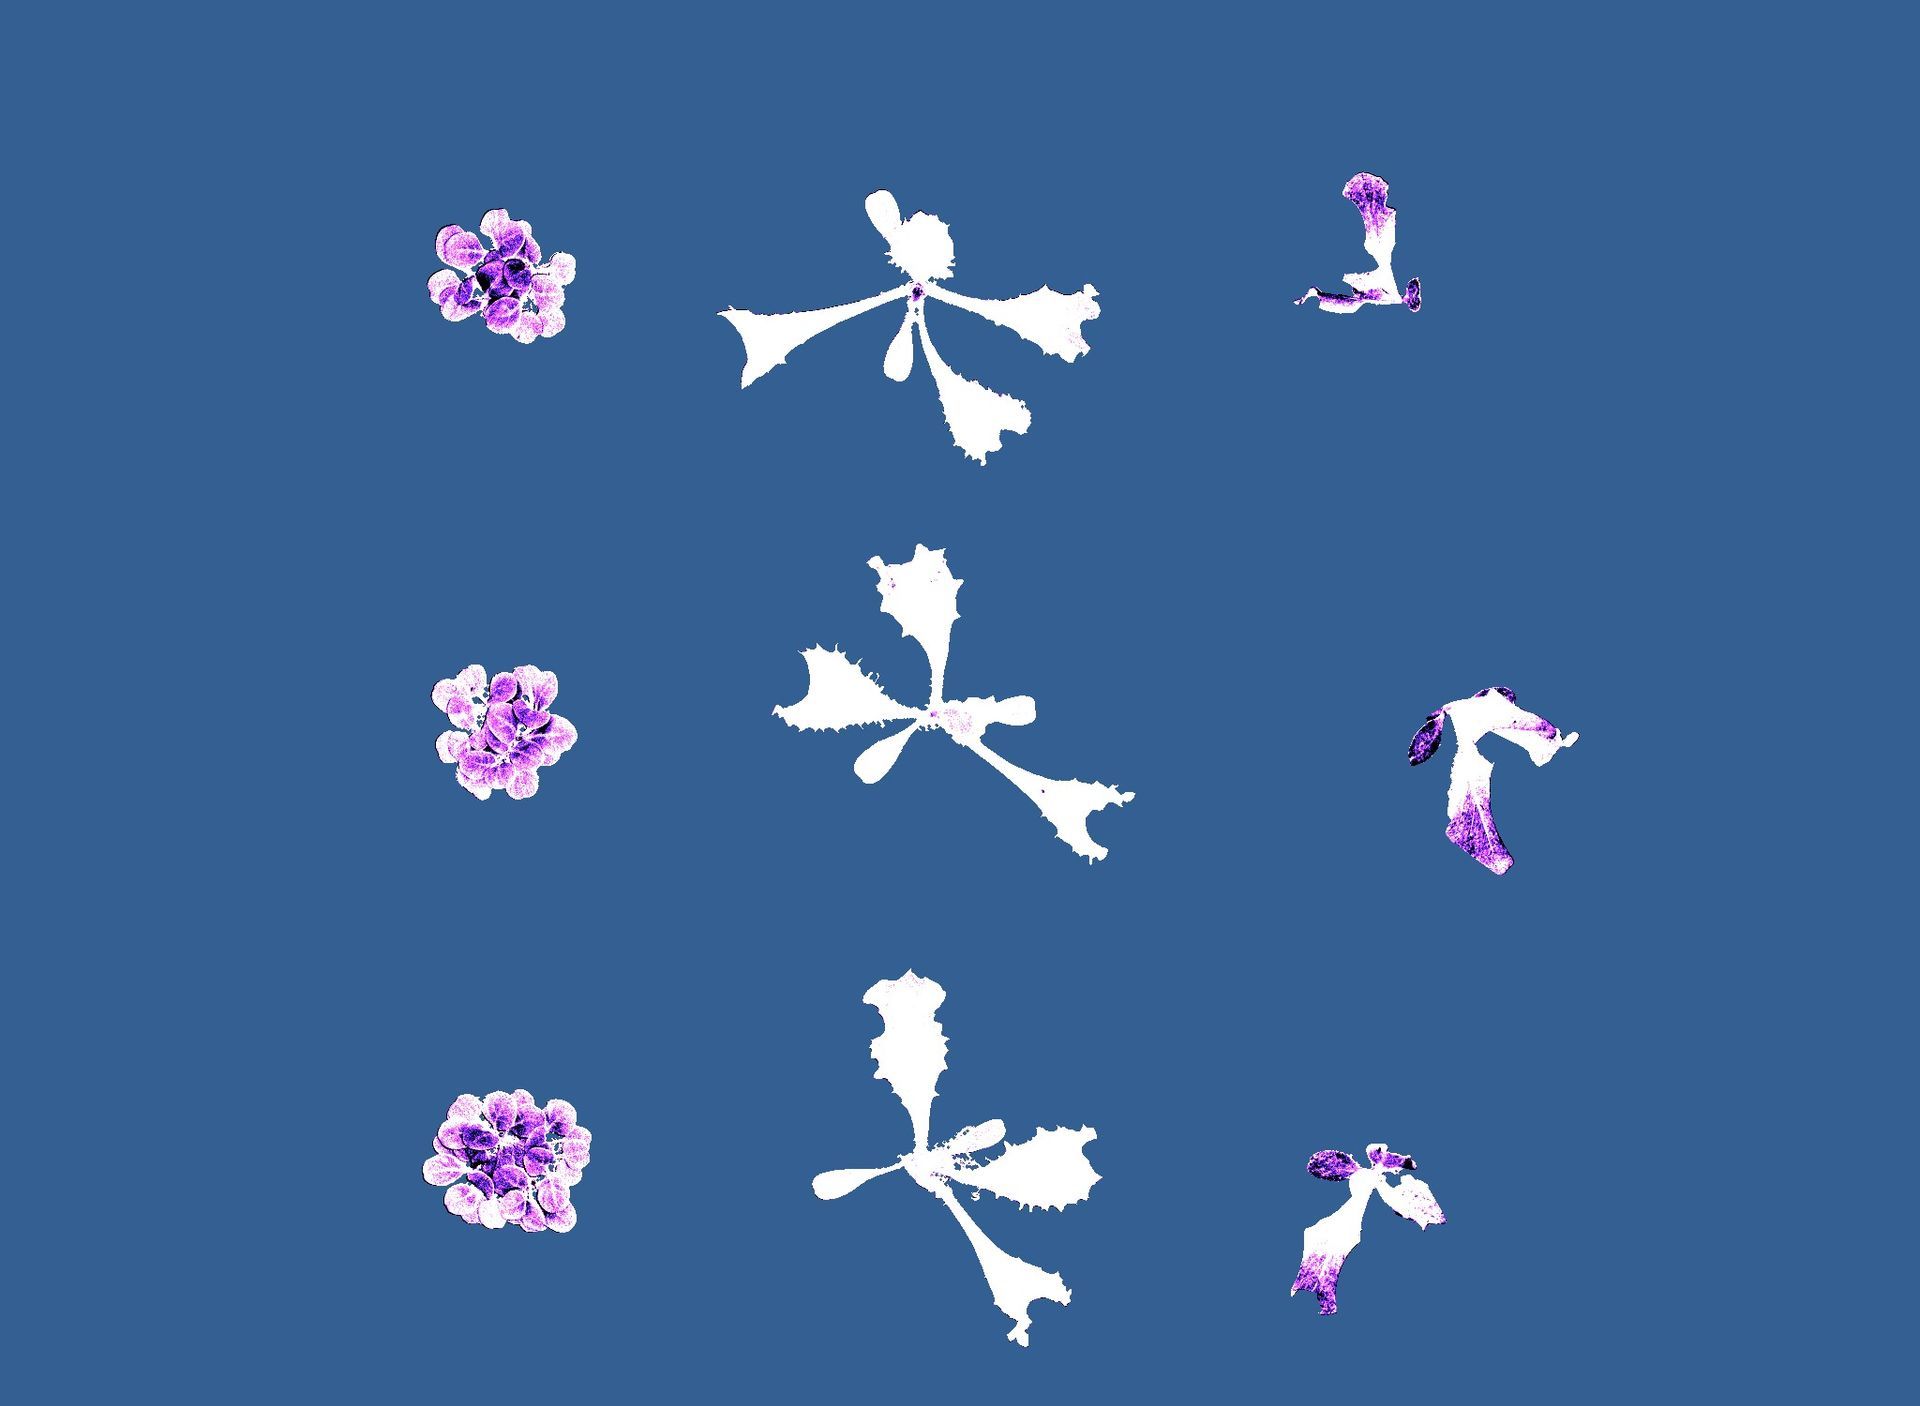
The PlantExplorer MAX offers versatile imaging capabilities, allowing it to measure dual GFP (405nm and 470nm) or function as a GFP and RFP system. With GFP and/or RFP labeling, you can selectively image modified pathogens and simultaneously capture the plant's stress response through chlorophyll fluorescence technology. This advanced system facilitates early pathogen detection and monitors their impact on plant photosynthesis. Additionally, GFP images are corrected for auto-fluorescence from aging leaves.
Corrected
auto fluorescence
No correction
auto fluorescence
Correcting for autofluorescence, as demonstrated in the images above, is crucial. Without correction, autofluorescence can be misinterpreted as the effect of the pathogen
System integrations
MAX Field
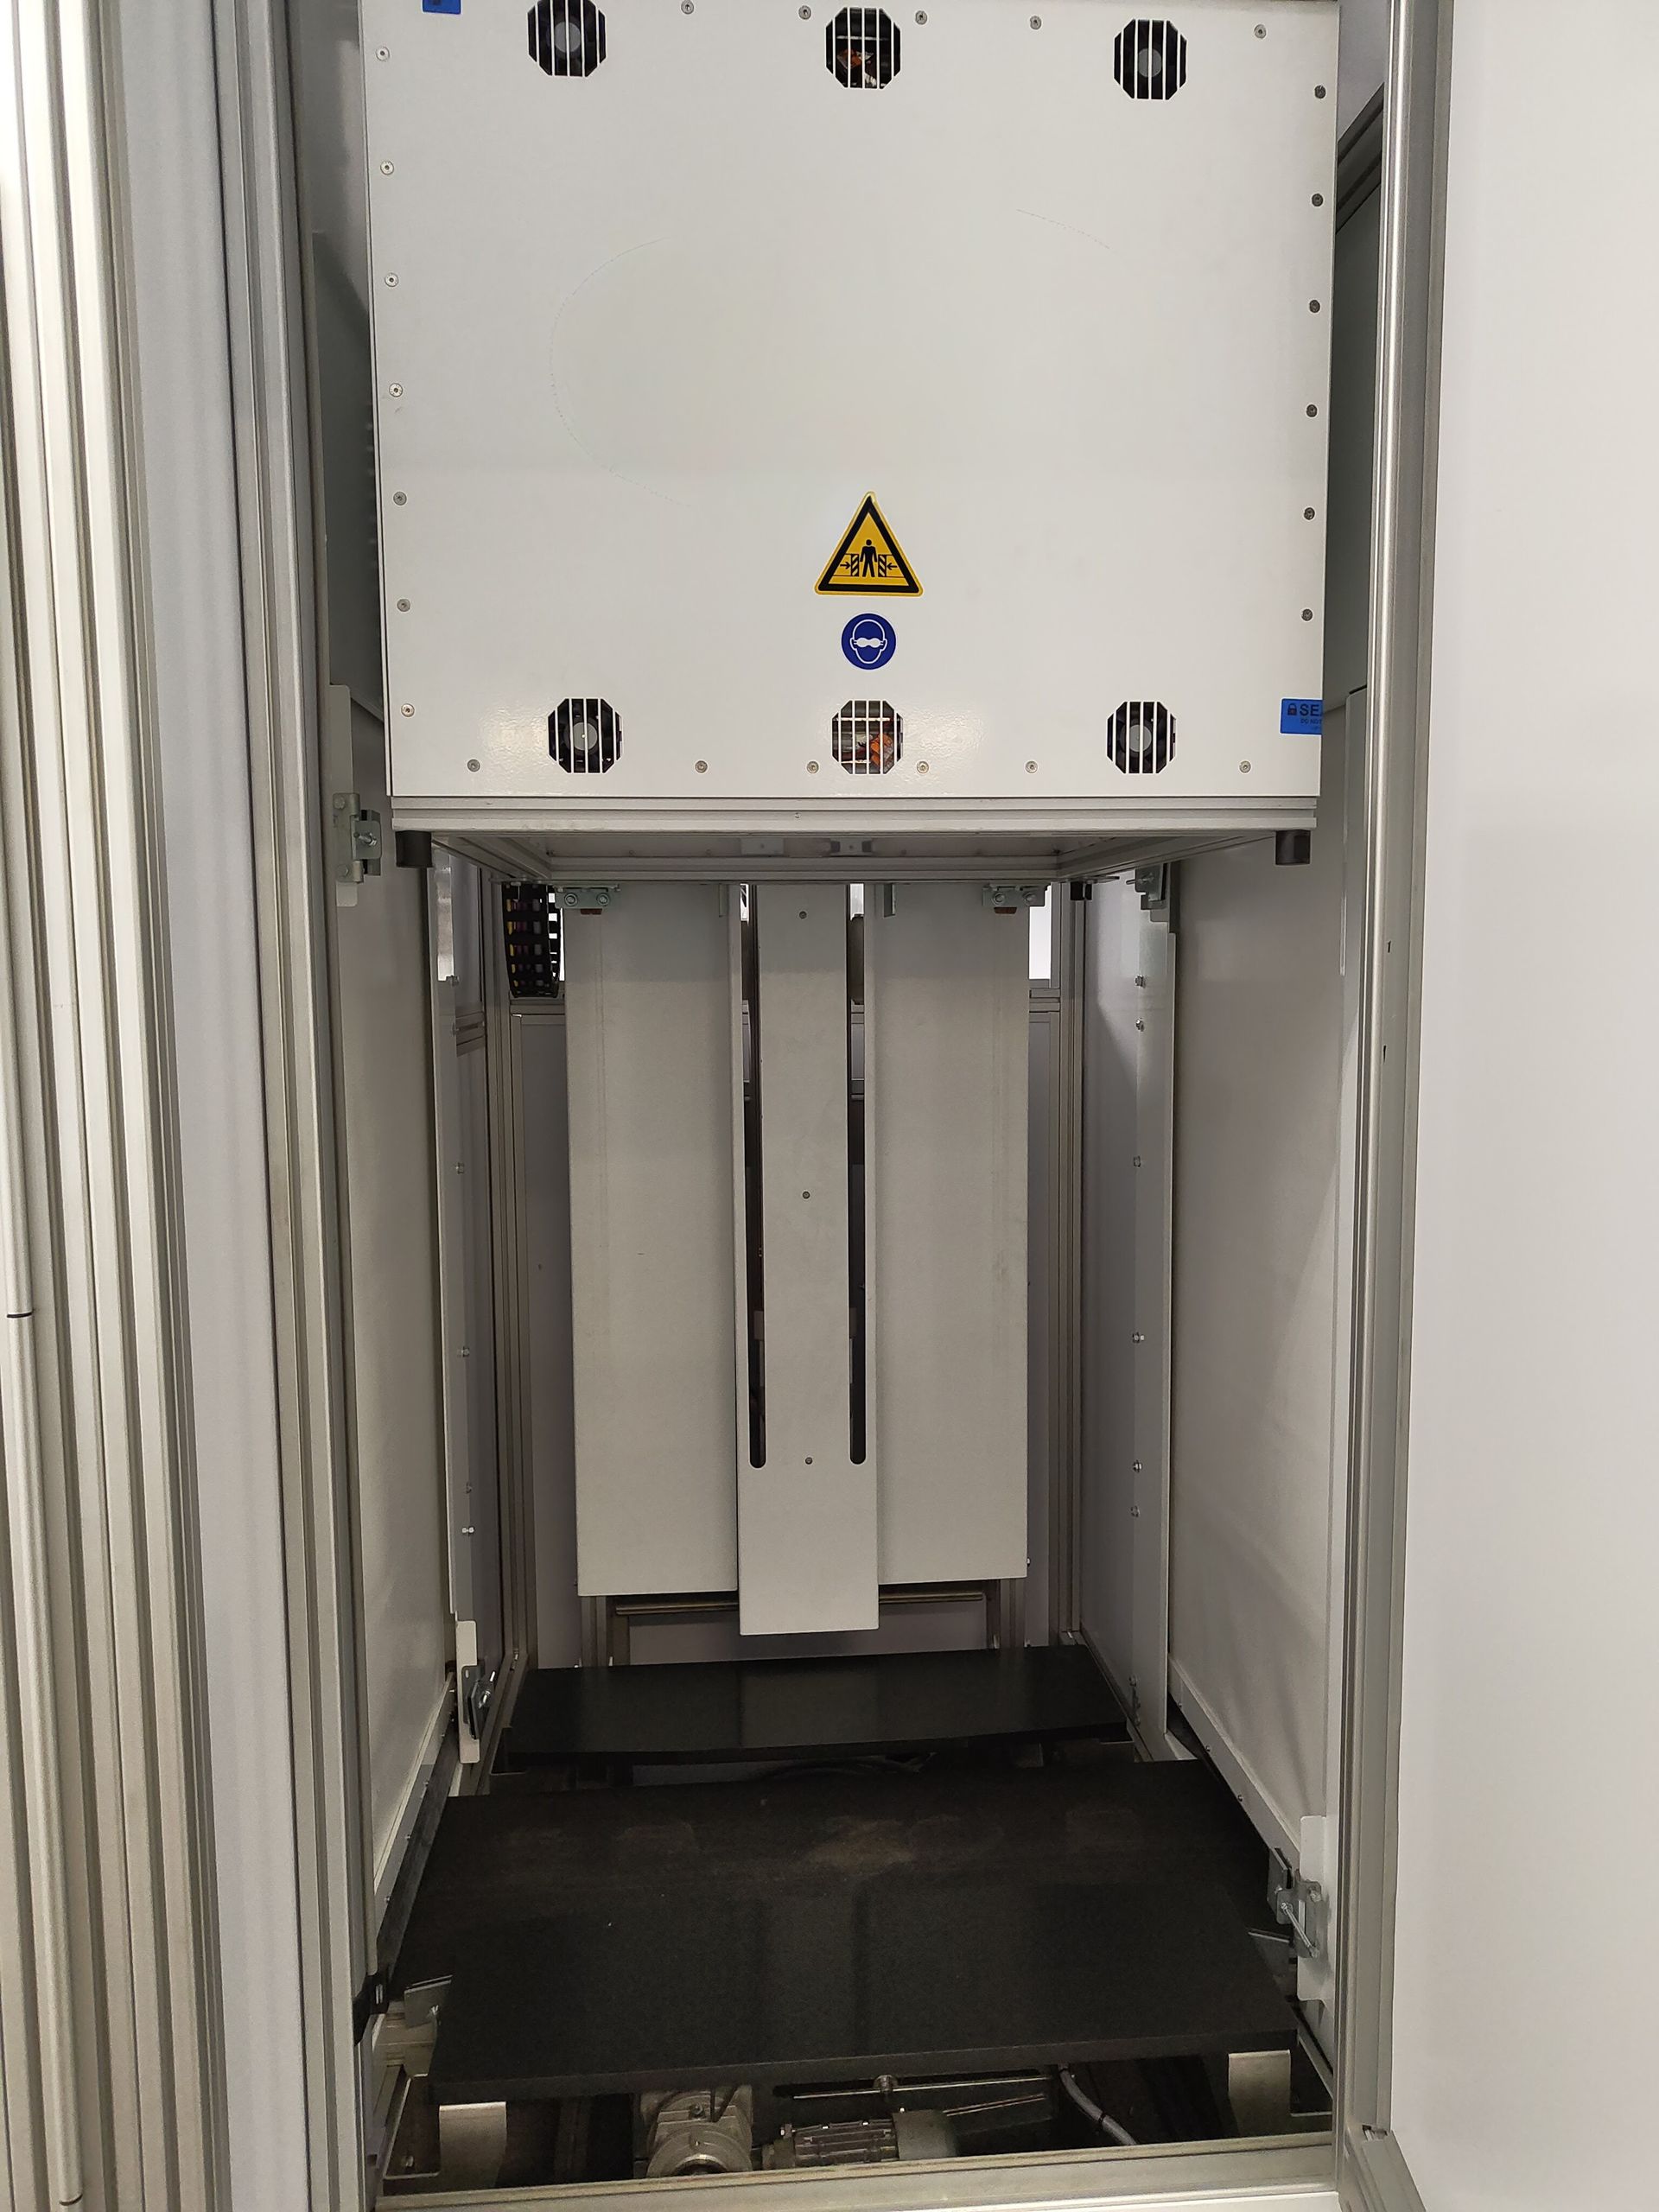
The PlantExplorer MAX+ is also available as the PlantExplorer MAX Field, a versatile system without an enclosed cabinet. This design allows for seamless integration into conveyor belt or gantry systems, as shown in the image.
The PlantExplorer MAX Field can be configured in two ways: Plant-to-Sensor or Sensor-to-Plant. Thanks to our advanced software, the system can be remotely controlled by either the system integrator or the client. PhenoVation provides a comprehensive manual to guide users through the setup and operation process.
Control Software
PhenoVation provides license-free software with regular updates. Our foolproof user interface ensures a plug-and-play experience right out of the box. For advanced users, an expert mode is available to customize protocols and integration times, as well as develop new protocols. The standard interface locks these advanced features to prevent errors by inexperienced users.
Key Features
- Live mode for easy focusing
- Software controlled focusing unit
- Real-time measurement results
- Simple protocol selection
- Save and open predefined protocols
- Barcode scanner integration
- Remote control for users and system integrators
- Auto-record function available
This video demonstrates the boot-up procedure, a PAM dark and ChFl measurement, and a PAM quenching measurement + Absorption done with a PlantExplorer XS
For tutorials on using our analysis software, click here.
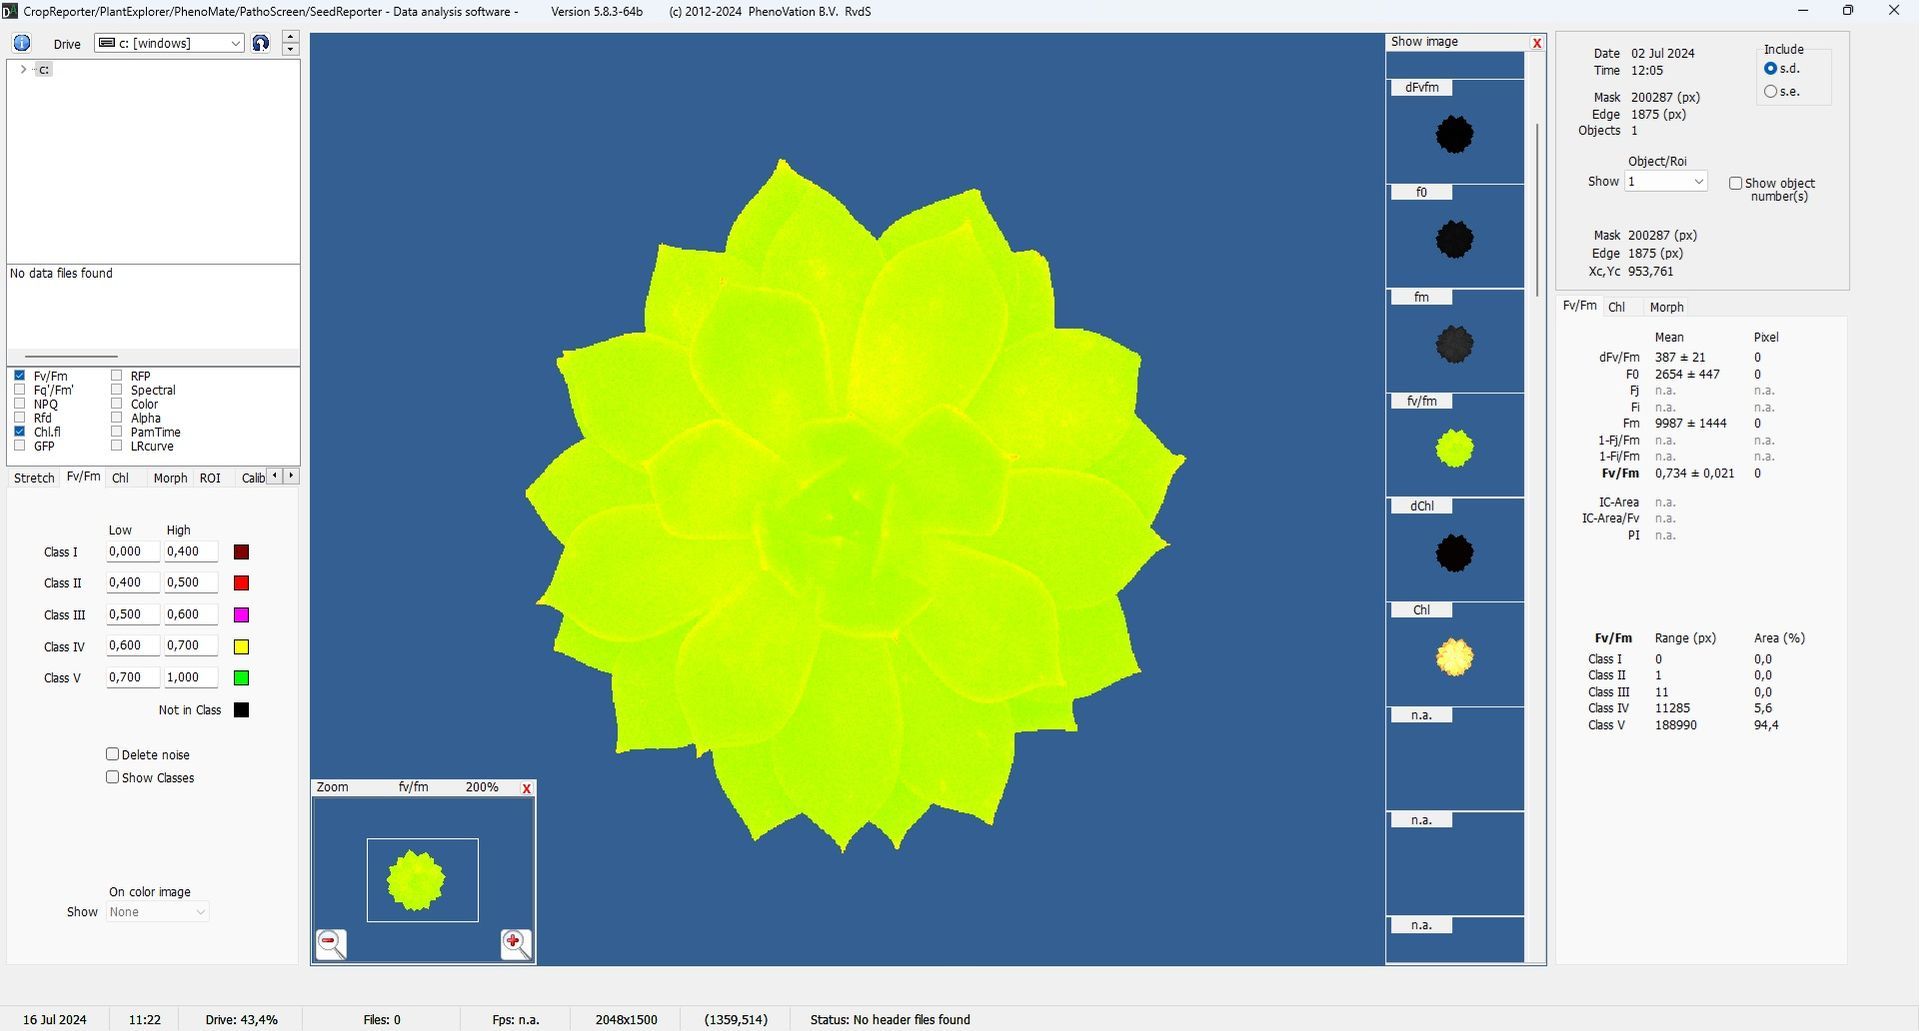
Analysis software
PhenoVation includes license-free analysis software with all our camera systems. This powerful software supports a wide range of plant phenotyping analyses and operates in a semi-automatic mode for efficient batch data analysis.
Key Features
- User-friendly interface, no programming skills required
- License-free with regular updates
- Calculates averages per plant or region of interest
- Supports well plate imaging up to 1536 wells
- Automated image export
- Customizable background colors and false color scales
- Easily save and open analysis protocols
Do you have a question?
We are here to answer all your questions. Don't hesitate to contact our experts to find out everything about photosynthesis, color imaging and everything in between.
What do our clients say?
Our references.

Dr. David Han (PhenoTrait)
Magdalena Julkowska (Boyce Thompson Institute)
Sina Roth (Bayer)
Prof. Kris Audenaert (Ghent University)
Dr. Katie Murphy (Donald Danforth Plant Science Center)
Michael Meijler WPS